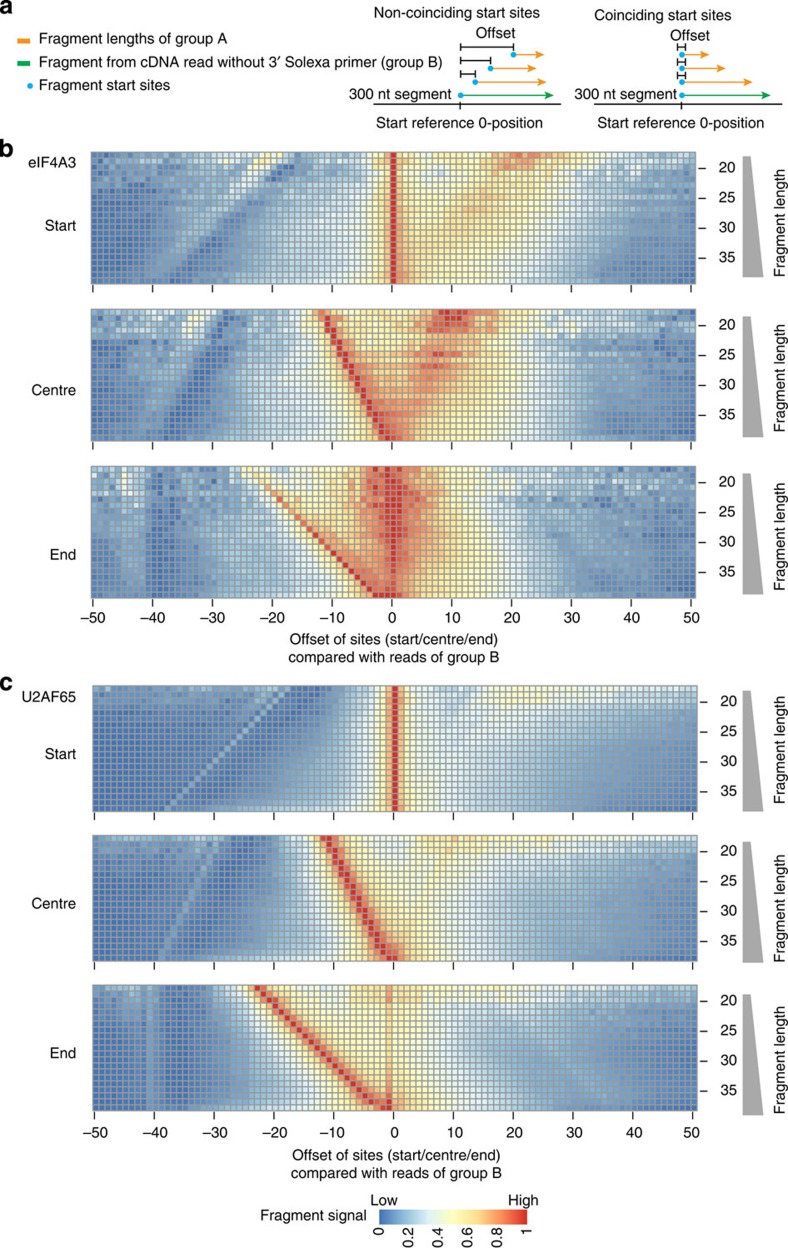
Figure 4. High-resolution read overlap heatmaps for the start, centre and end positions of iCLIP fragments for eIF4A3 and U2AF65.
(a) Schematic representation of the method. The high-resolution read overlap heatmaps are shown for (b) eIF4A3 (mean overlap start site ratio 0.88) and (c) U2AF65 (1.31). For this analysis, the distance of the start sites between random barcodes evaluated fragments that map to the same region at the reference genome is plotted on the x-axis (b and c top panel). As a reference, the start sites of the group B fragments are used to calculate the distance to the start site of the fragments of group A. A peak at the reference position 0 corresponds to coinciding start sites of group B and group A fragments, whereas a distribution downstream of the reference position 0 arises from the start sites of group A fragments that occur at length-dependent offsets from the group B start sites. The same procedure was applied to the centre (b and c middle panel) and end positions (b and c bottom panel) of the sequenced fragments (group A and B). The number of fragments for each fragment length is shown in Supplementary Fig. 1.

