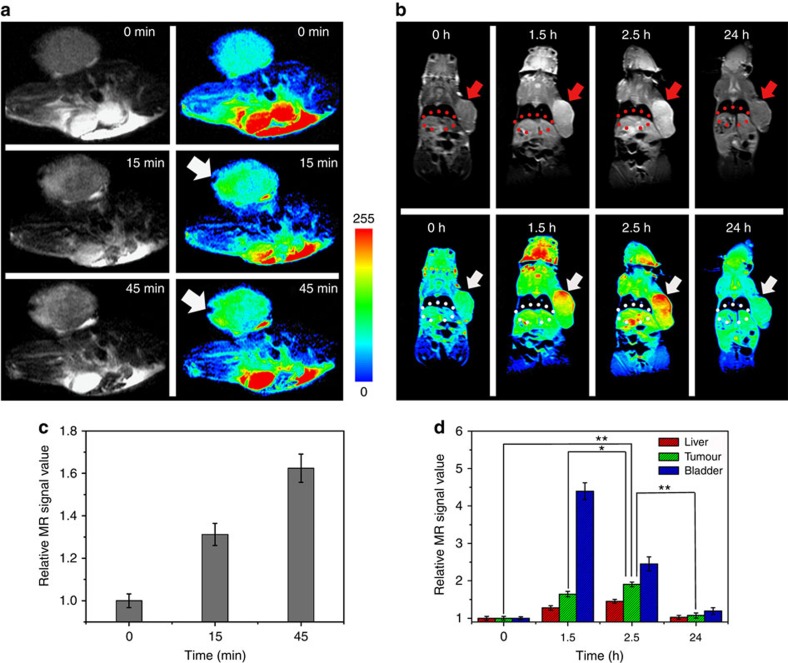
Figure 3. In vivo MRI of colorectal tumour xenografts.
In vivo magnetic resonance images of nude mice bearing colorectal tumours after (a) intratumour injection (injection site, arrows) and (b) intravenous injection (tumour, arrows; liver, ellipses) of Fe-CPNDs at different time intervals (0 min and 0 h indicate pre-injection). (c) Corresponding data analysis of the tumour in a. (d) Corresponding data analysis of the tumour, bladder and liver in b. Error bars indicate the s.d. (n=5, **P<0.01 or *P<0.05 from an analysis of variance with Tukey's post-test). The tumours are ∼700 mm3 in volume.

