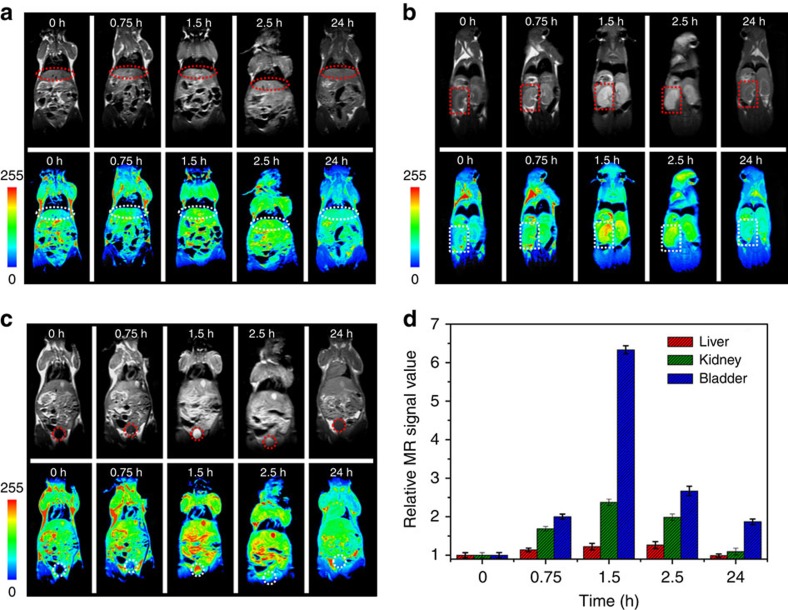
Figure 6. In vivo biodistribution and clearance of Fe-CPNDs.
In vivo magnetic resonance images of the (a) liver (ellipses), (b) kidney (rectangles) and (c) bladder (circles) after the intravenous injection of Fe-CPNDs at different time intervals (0 h indicates pre-injection.). (d) Corresponding data analysis of the magnetic resonance measurements. Error bars indicate the s.d. (n=5).

