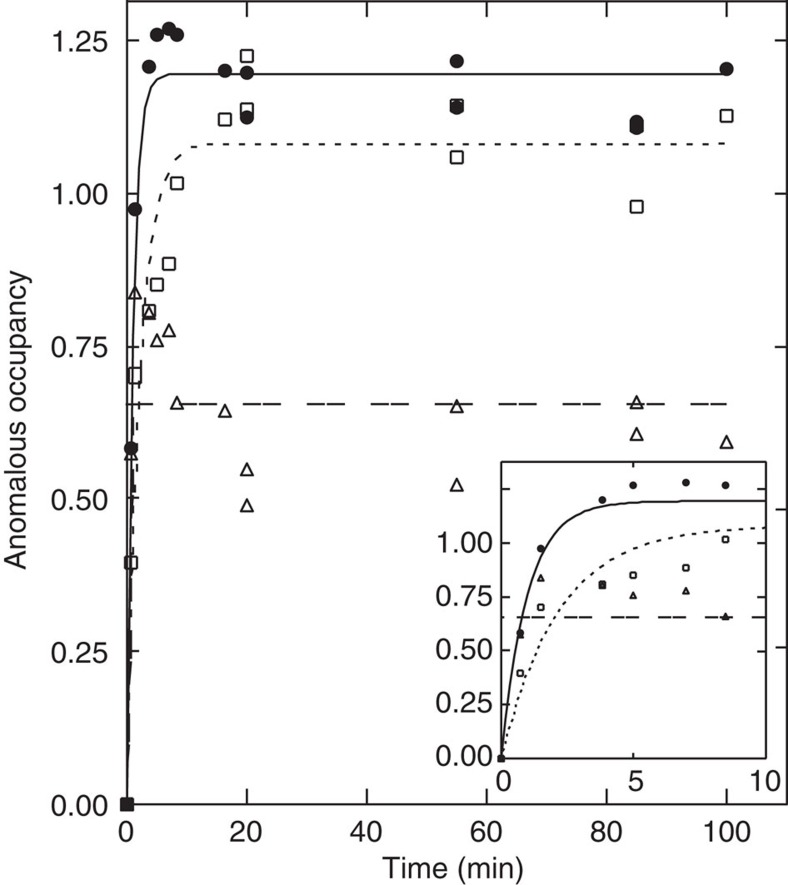
Figure 4. Time course of the change in occupancy of Tl+ that has substituted bound K+ in the crystal.
Open squares, filled circles and open triangles, respectively, represent the anomalous occupancy at sites I, II and C, as determined with CNS15. Curves are single exponential fits to the data with time constants of 41 and 105 s. Inset shows the initial part of the same data.

