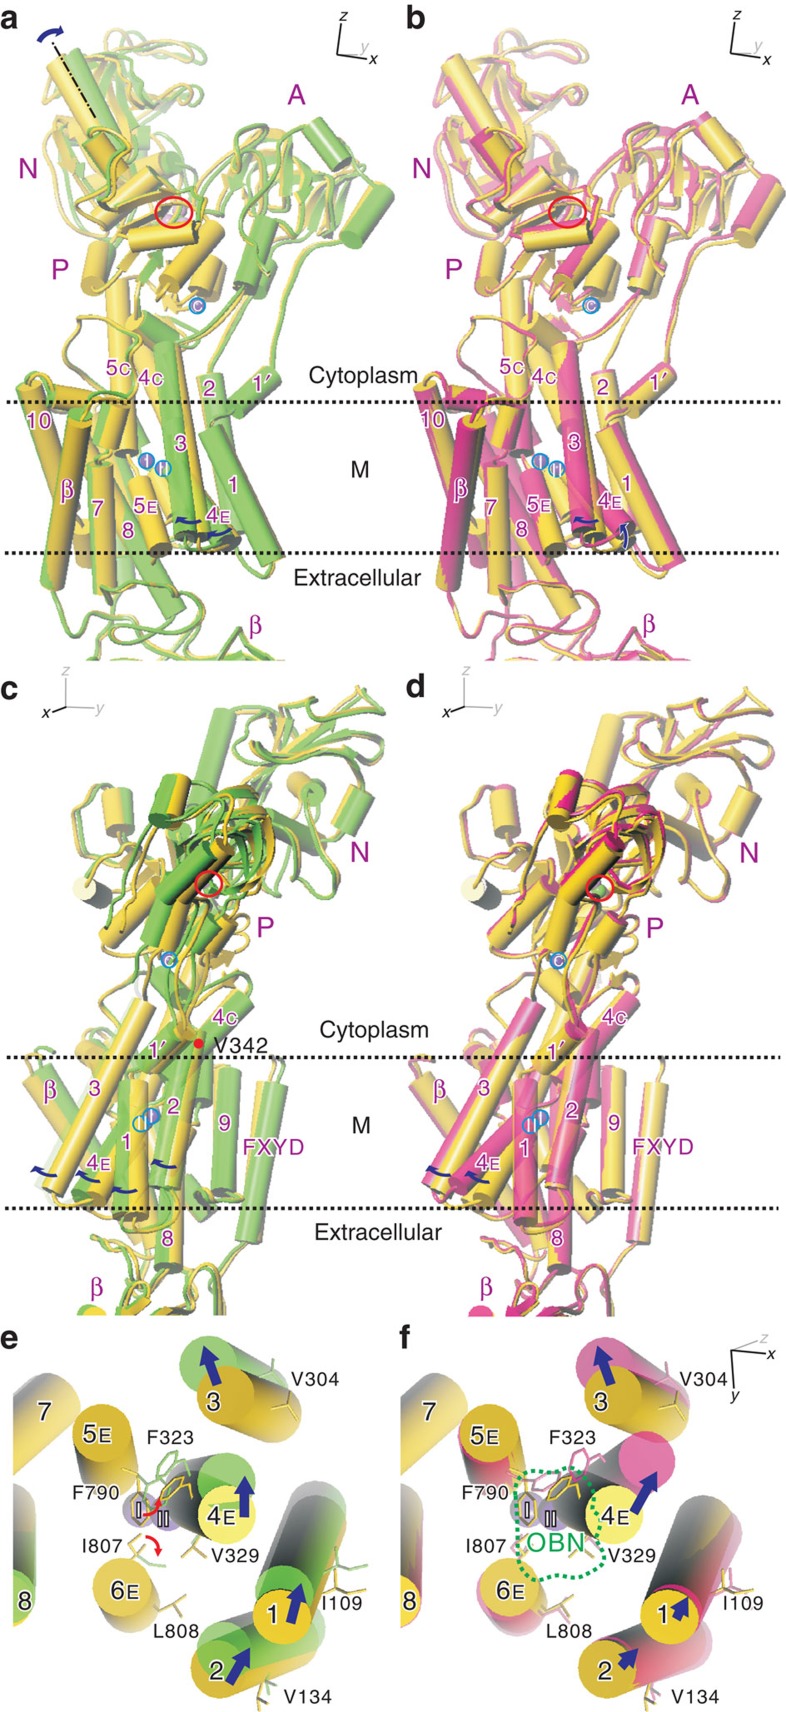
Figure 6. Segmental movements of Na+,K+-ATPase in the E2·2K+·MgF42- crystal.
(a,c,e) Superimposition of the atomic models of the ATPase in the ‘average' (yellow; PDB ID: 2ZXE) and ‘open' (light green) conformations. The model in the ‘open' conformation, in which the extracellular pathway to the K+-binding sites is most widely opened by thermal movements, was deduced by TLSMD16. (b,d,f) Superimposition of the atomic model of the ATPase in the ‘average' conformation (yellow) and that of an ouabain-bound form (PDB ID: 3A3Y; pink). The ouabain-bound form of Na+,K+-ATPase was made by soaking the E2·MgF42−·2K+ crystals in a buffer containing 20 mM ouabain. Front views (a,b), side views (c,d) of the whole molecule and bottom views (that is, approximately normal to the membrane from the extracellular side) of the transmembrane region (e,f). Purple spheres (marked I, II and C) represent bound K+, and green ones MgF42− (also circled in red). Arrows indicate the directions of segmental movements (from the ‘average' structure to the ‘open' conformation). Small red arrows in e indicate likely conformational changes of the side chains to open the ion pathway. Dotted line in f shows the outline of ouabain (OBN), which is removed from the atomic model. See Supplementary Fig. 7 for stereo figures of e and f.

