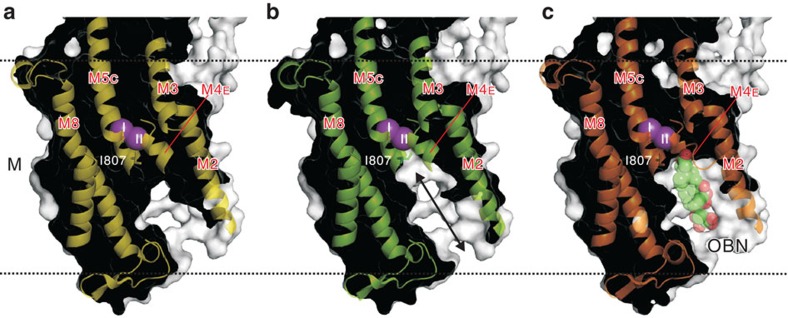
Figure 7. Cross-sections of the transmembrane region of Na+,K+-ATPase in E2·2K+·MgF42−.
(a) The ‘average' conformation (PDB ID: 2ZXE); (b) the ‘open' conformation as deduced by TLSMD16, showing ion pathway on the extracellular side; (c) the ouabain-bound form (PDB ID: 3A3Y). van der Waals surface generated with PyMol. Purple spheres (I and II) represent bound K+. Ouabain (OBN) bound to the ATPase with low affinity is shown in space fill. Ile807 on M6 (forming the back wall of the ion pathway in this figure) may change the side chain conformation to open the ion pathway ((b), double-headed arrow). Ouabain suppresses such a conformational change of Ile807 (c).

