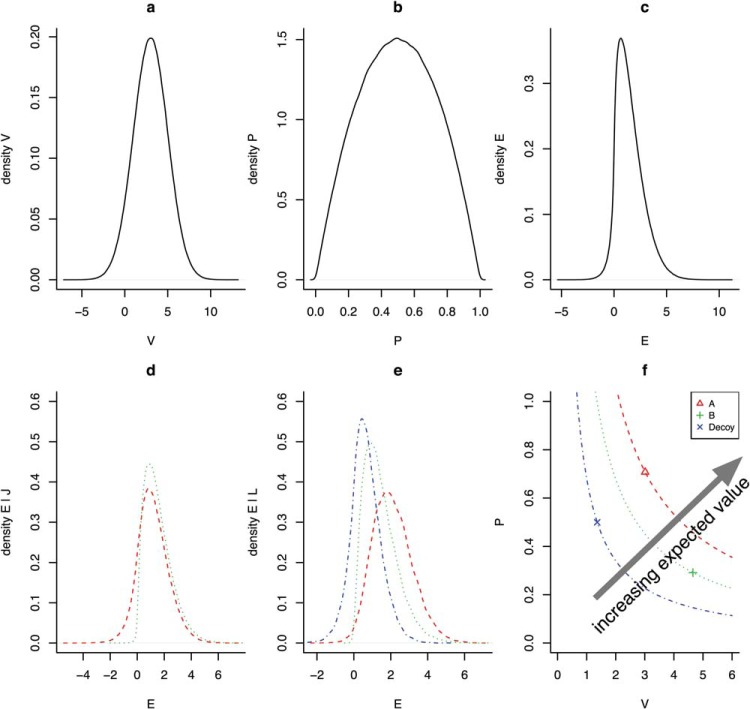
Figure 12.
(a and b) Values of p for each option were sampled from a β distribution with shape parameters (2, 2) and values of v were sampled, independently, from a Gaussian distribution with mean = 3, SD = 2. (c) The density of expected values, E = p × v, of options given no constraints. (d) Densities of E | J for each of two options. (e) Densities of E | L for the three options that include the decoy. (f) E of each of the three options and their equal expected value curves given L. J and L are ordinal constraints specified in the text. See the online article for the color version of this figure.

