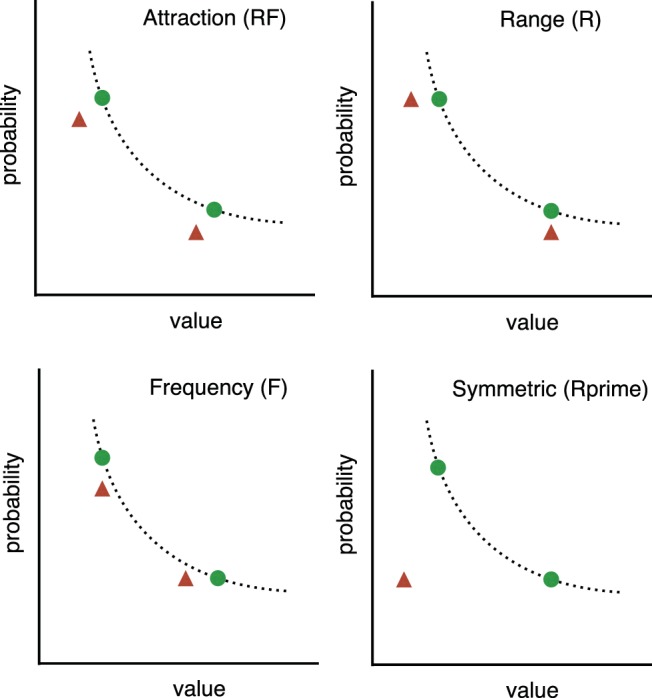
Figure 4.

Option positions (R, F, RF, and Rprime) used by Wedell (1991). The dotted line represents the line of equal expected value on which two of the three options sit (green circles). The third option is the decoy (red triangle) and it is in one of two positions in each condition. Its position varies according to condition but it is always dominated by one of the other two options on at least one feature dimension (probability or value). See the online article for the color version of this figure.
