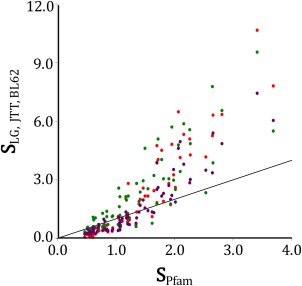
Figure 2.

Predicted relative exchangeabilities (S) calculated from equilibrium amino acid frequencies and from a set of standard substitution matrices. The site‐specific amino acid frequencies were based on Pfam protein alignments and calculated with Eq. (5), whereas the substitution matrix exchangeabilities were calculated for Le and Gascuel15 (red), JTT13 (green), and Blossum6212 (purple). In all cases, the rate matrices from which the exchangeabilities were derived were normalized so that the average substitution rate was 1.0.
