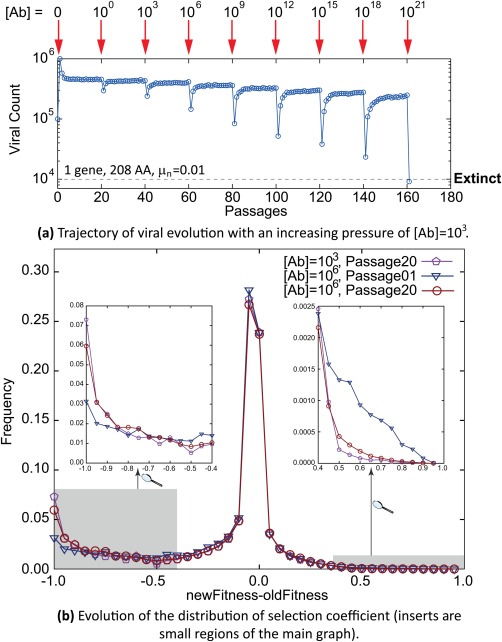
Figure 2.

Viral evolution under an increasing pressure. In panel (a), the viral count first increases because we start the simulations with very stable proteins and P inf is close to 1. The viral count then quickly equilibrates. When antibodies are “added”, the viral count dramatically drops under the pressure before reaching again a steady‐state. As the concentration of antibodies is increased, the viral titer keeps dropping and equilibrating. When [Ab] is too high, the viral count drops to the extinction. In panel (b), we can observe that the distribution of selection coefficient is not fixed depending on the conditions. When the concentration of antibodies increases (last passage with [Ab]=103 in purple pentagons to first passage with [Ab]=106 in blue triangles), the system is no more equilibrated. Thus, the fraction of lethal mutations decreases (insert on the left) and the fraction of beneficial mutations increases (insert on the right). After 20 passages without changing the environment (last passage with [Ab]=106 in red circles), the system had enough opportunity to adapt and the distribution of selection coefficient recovers its shape prior to the subsequent change of antibodies concentration. (a) Trajectory of viral evolution with an increasing pressure of [Ab]=103. (b) Evolution of the distribution of selection coefficient (inserts are small regions of the main graph).
