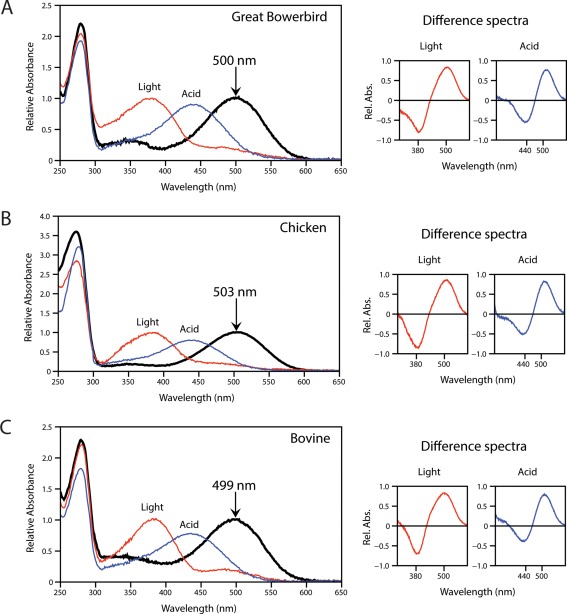
Figure 1.

Characterization of great bowerbird rhodopsin (A) as compared with chicken (B) and bovine (C) rhodopsin controls. Absorption spectra show bleaching by light (red) and acid (blue) with the shifted peaks that result after sample exposure to white light (λ max = 380 nm), or to 100 mM hydrochloric acid (λ max = 440 nm), indicating a functional active state and Schiff base respectively. Dark‐light and dark‐acid difference spectra are shown to the right of each panel. The indicated λ max values were estimated according to the curve‐fitting methodology of Govardovskii.71
