
Figure 5.
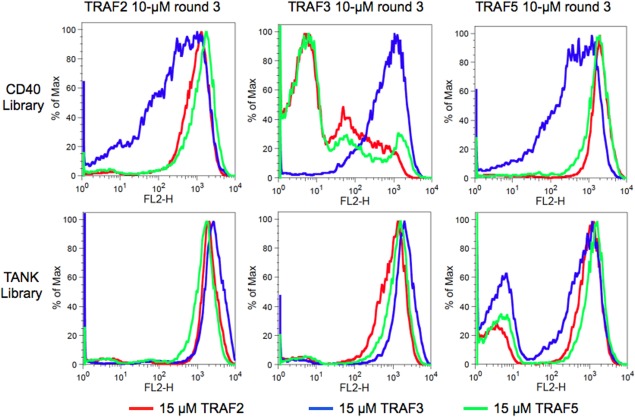
TRAFs 2, 3, and 5 binding to the final CD40 and TANK library pools. Columns are labeled with the sorting pool analyzed (round 3, done at 10 μM for each TRAF), with CD40 library pools on top and TANK library pools on bottom. The conditions used for analysis are colored: binding to 15 μM TRAF2 (red), TRAF3 (blue), or TRAF5 (green). The bi‐modal population in the TANK library sorted for binding to TRAF5 is due to incomplete enrichment for binders. The x axis is the fluorescence due to TRAFs bound to the cell surface, and the y axis is proportional to the number of events. Data are representative of three experiments performed on separate days.