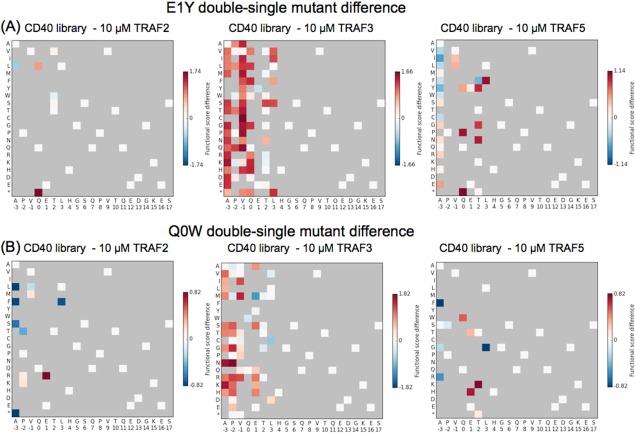
Figure 10.

Changes in functional scores for single mutants in the wild‐type background vs. in the presence of E1Y or Q0W. For substitutions that appeared in the double mutant pools with (A) E1Y or (B) Q0W, a change in functional score was calculated as the double‐mutant functional score minus the single‐mutant functional score. Red indicates residues that were more enriched in the presence of E1Y or Q0W than in the wild‐type background.
