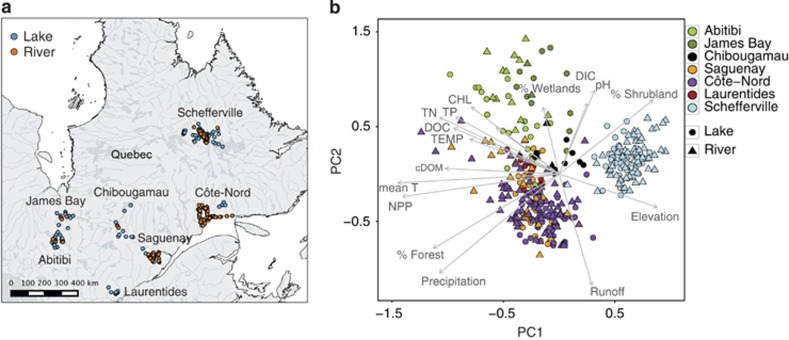
Figure 2.
(a) Distribution of sampling sites across the seven sampled regions in Northern Québec (Canada). (b) Principal component analysis (PCA) of the sites based on the measured environmental and geographic parameters. Different regions are indicated by different colors and symbols indicate rivers (triangle) or lakes (circles). The two first axes explain 44.5% of the variance. Chl a, chlorophyll a; Cond, conductivity; DIC, dissolved inorganic carbon; %C2, percentage of fluorescent component C2 (humic-like DOM); %C5, percentage of fluorescent component C5 (freshly produced labile DOM); Elevation, mean catchment elevation; Mean T, mean annual temperature; NPP, net primary productivity; Precipitation, mean annual precipitation; Runoff, mean annual runoff; %Forest/%Shrubland/%Wetland, %forest/shrubland/wetland covered area in the catchment; Temp, water temperature; TP;TN, total phosphorus and nitrogen.

