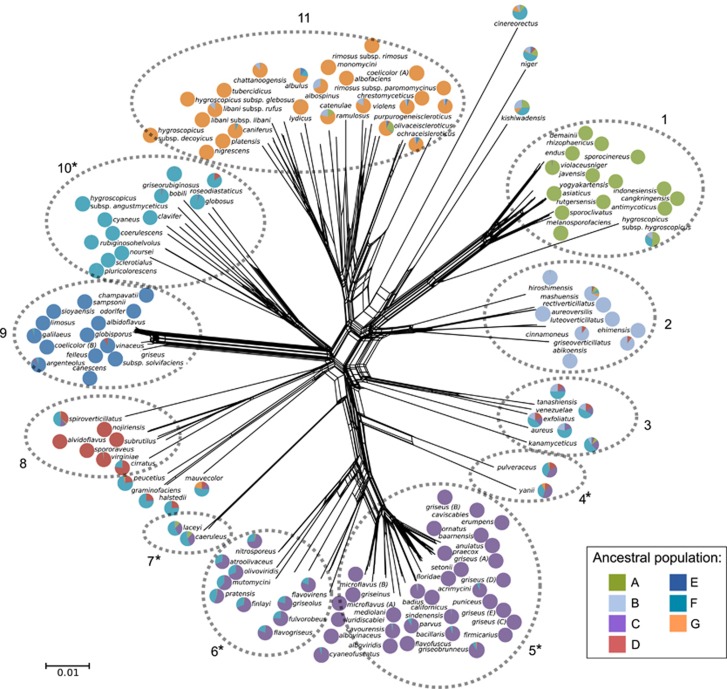
Figure 1.
A phylogenetic network for Streptomyces generated using SplitsTree with default settings. The network was built using concatenated sequences of 16S rRNA, trpB, atpD, gyrB, rpoB and recA loci. The pie charts associated with each species show the ancestry of each species, with each color representing the seven ancestral lineages inferred by Structure. The dotted circles highlight distinct clusters. Asterisks indicate clusters targeted for further analysis including those with high (4 and 6) and low (5 and 10) admixture. Admixed clusters 4, 6 and 7 have genetic contributions from clusters 5 and 10. Scale bar indicates 0.01 substitutions per site.

