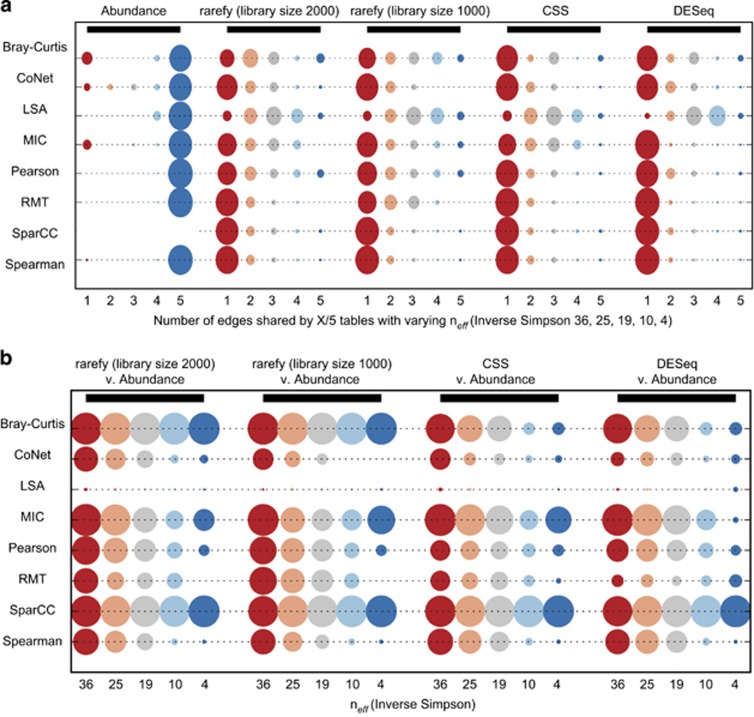
Figure 2.
The impact of compositional data and normalization strategy on reconstructing actual microbial interactions. Five tables with varying neff (36, 25, 19, 10, 4) were created by multiplication of the abundances of one OTU pair by a constant; all other OTU abundances remained the same for all tables. These ‘Abundance' tables represent the actual OTU abundances in the environment. SparCC assumes the data table is compositional, and hence is not shown. Then, the ‘Abundance' tables were sampled without replacement (rarefied), constraining the sum and inducing compositionality, mimicking the experimental sampling process. The rarefied (2000 library size) tables were then either rarefied further (rarefy 1000 library size), CSS normalized or DESeq normalized. From left to right: (a) The five circles within each normalization technique represent: of all the edges found in the five neff tables, the number of edges found 1 (red)—5 (blue) times. A technique less affected by the compositional nature of the data has a larger circle at point 5, as most tools do in the ‘Abundance' tables. (b) Precision of a tool's estimates on the compositional normalized tables as compared with the same tool's predictions on the ‘Abundance' tables for a given neff. A larger circle represents better reconstruction of the true ‘Abundance' OTU correlations.

