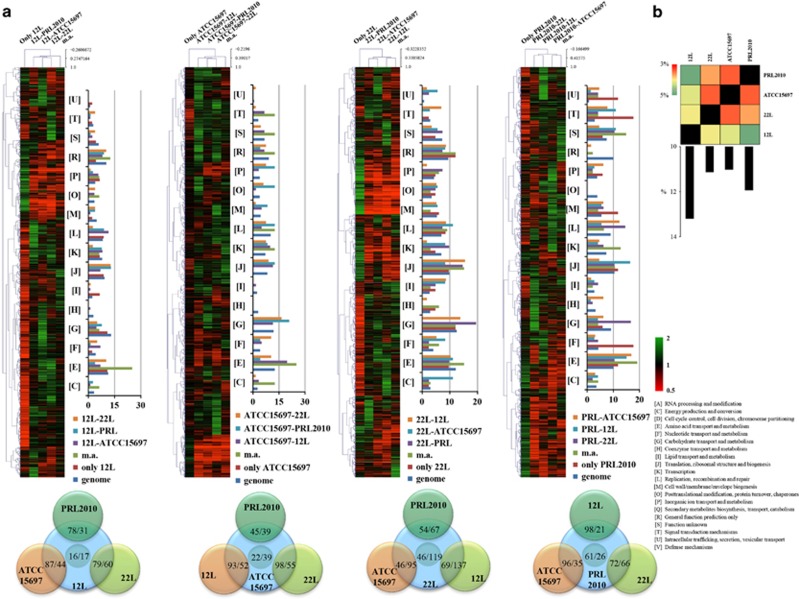
Figure 1.
Transcriptomes of bifidobacteria when present in the murine cecum. (a) Identification of B. breve 12L, B. longum subsp. infantis ATCC15697, B. adolescentis 22L and B. bifidum PRL2010 differentially expressed genes by transcriptome analysis in response to mono- bi- or multiple association (m.a.) in mice. Each heat map displays the fold change in gene expression for 12L, ATCC15697, 22L and PRL2010 (from right to left) according to the condition indicated above the heat map. Each row represents a separate transcript and each column represents a separate sample. A color legend is displayed on the bottom of the microarray plot. The dendrogram on the left margin of the heat map represents the hierarchical clustering algorithm result based on average linkage (UPGMA) and Euclidean distance of the gene data set. Functional annotation of the in vivo-expressed genes of the different bifidobacterial strains according to their cluster orthologues gene (COG) categories is shown at the right-hand margin of each heat map. Each COG family is identified by a one-letter abbreviation (NCBI database). The percentage was calculated as the percentage of transcribed genes belonging to the indicated COG category with respect to all transcribed genes. A Venn diagram displaying the number of genes expressed by 12L, ATCC15697, 22L and PRL2010 strain upon contact each other is represented at the bottom of each heat map. (b) A heat map representing the cross-talk index. Bar plots represent the sum of the single cross-talk indexes for each strain. Values are expressed as percentages.

