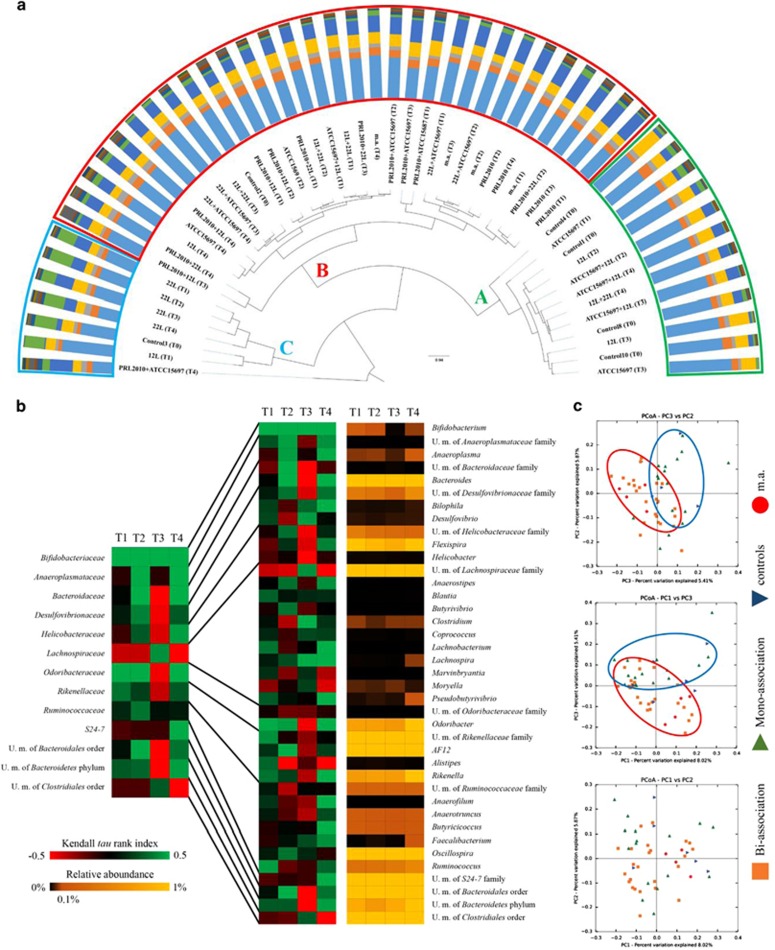
Figure 2.
Modulation of murine fecal microbiota composition by the presence of bifidobacteria. (a) Displays the hierarchical clustering of the sample composition at family level based on a Pearson correlation matrix allowed the identification of three main clustering groups, named A, B and C. Microbiota profiling at family level of each sample is shown as a bar plot showing only families with relative abundances>1%. (b) Shows the Kendall tau rank generated when considering the average 16S rRNA profiles for each time point for the mono-, bi- and multiple associations, with respect to the Bifidobacteriaceae family and Bifidobacterium genus. Only genera constituting families with relative abundance>1% are shown. A positive Kendall tau rank value indicates co-occurrence, whereas a negative Kendall tau rank value indicates co-exclusion. (c) Shows the Unifrac beta-diversity expressed as principal coordinate analysis (PCoA) illustrating all the T0 and mono-, bi- and multiple association samples. T0 samples and mono-associations (circled in blue) cluster separately from bi- and multiple associations (circled in red).

