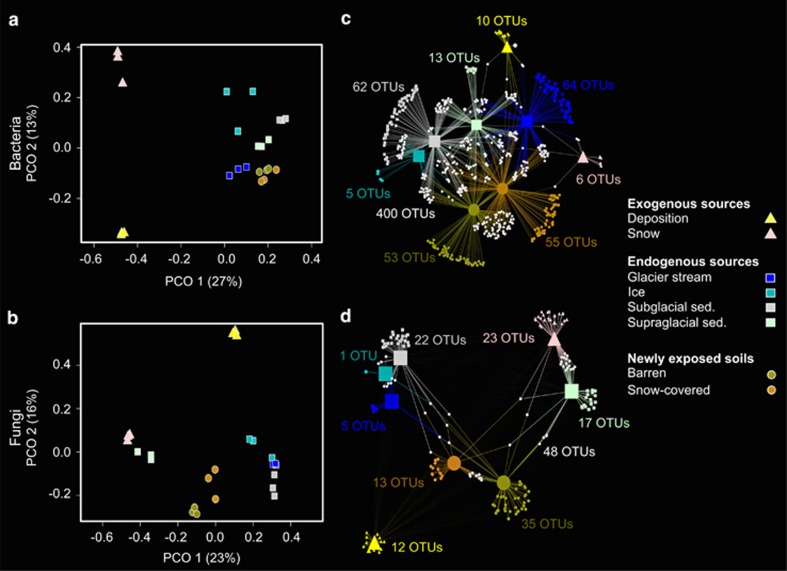
Figure 2.
Differences in total bacterial (a) and fungal (b) community structures shown by principal coordinate analysis ordinations (PCOs). The variance explained by each axis is given in parentheses. Colours and symbols are described in the figure. Bacterial (c) and fungal (d) bipartite association networks showing significant (q<0.05) positive associations between indicator OTUs and specific habitats, represented as nodes. Edges, that is, the connections between the habitat and an OTU, were weighted according to the point biserial correlation values. Node sizes represent the square-root of the relative abundances of each OTUs. Colours and symbols used to illustrate association between habitats and OTUs are identical to those in the PCOs. In addition, white hexagons represent OTUs that are significantly associated with more than one habitat (shared OTUs). The number of indicator OTUs is mentioned for each habitat.

