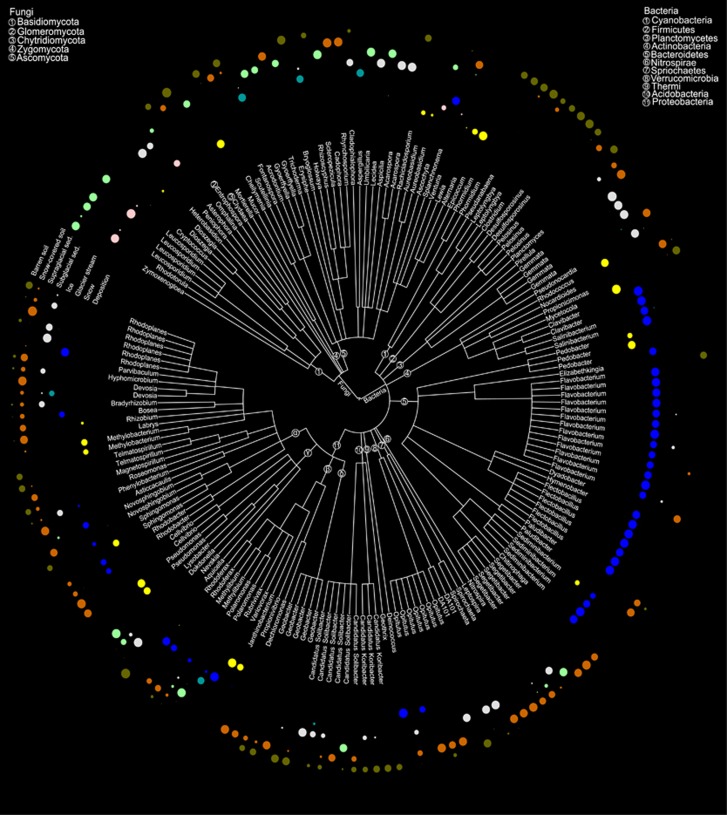
Figure 4.
Taxonomic tree representing the bacterial and fungal indicator OTUs classified at the genus level. The phyla within each domain are mapped on the branches of the taxonomic tree as numbers. Circles mapped in the outer rim of the tree represent the positive point biserial correlation values between each OTU and the habitats investigated.

