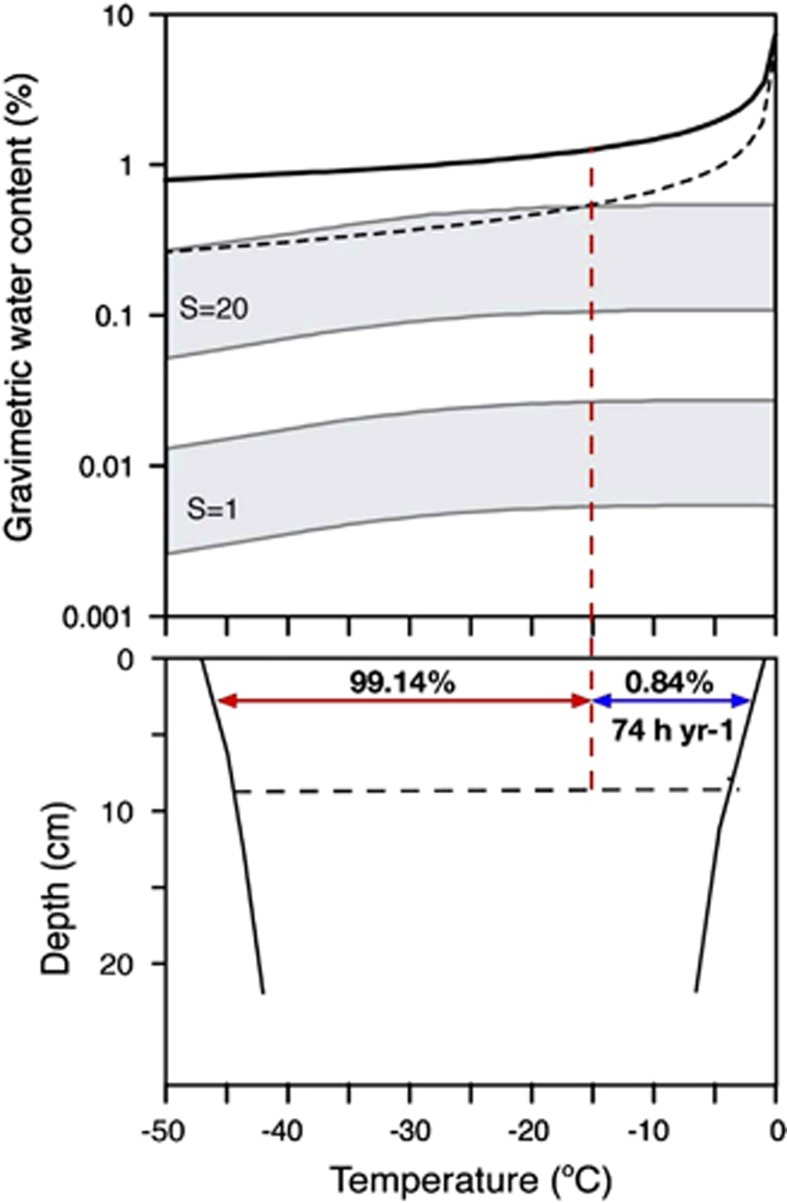
Figure 7.
Unfrozen water content in University Valley soils. (Top) Gravimetric (unfrozen) water content as a function of temperature in University Valley soils. The black dotted line includes the error in the sensors. Grey areas show the region for interfacial water for two values of specific surface area of soil particles. Soil water content transitions from bulk to interfacial at −15 °C (red dotted line, see Supplementary Text for details). (Bottom) Yearly envelope of soil temperatures near the head of the valley as a function of depth. The black dotted line shows the ice table at 8 cm depth. Bulk water is present in the dry soils above the ice table for up to 74 h per year.

