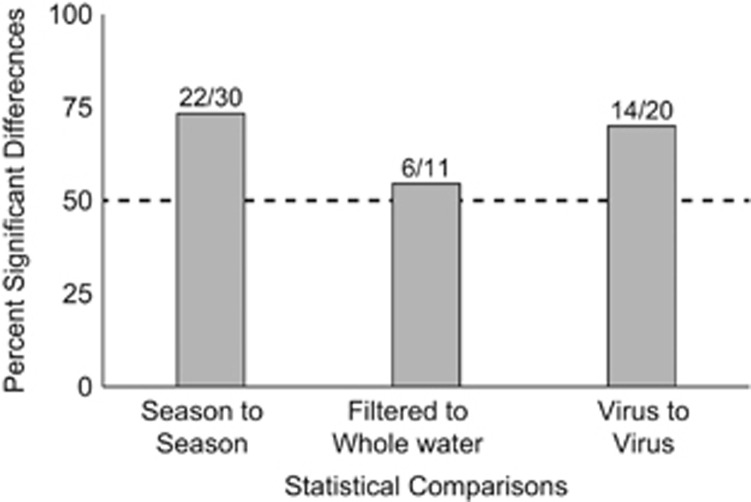
Figure 2.
Percentage of statistically significant differences in the comparisons between seasons, filtration treatment or viruses. Values were derived from the season to season, whole water to filtered water and virus-to-virus comparisons using the statistical tests from Supplementary Tables S1–S3, respectively. The numbers above each bar show the number of significantly different comparisons and the total number of comparisons.

