Figure 5.
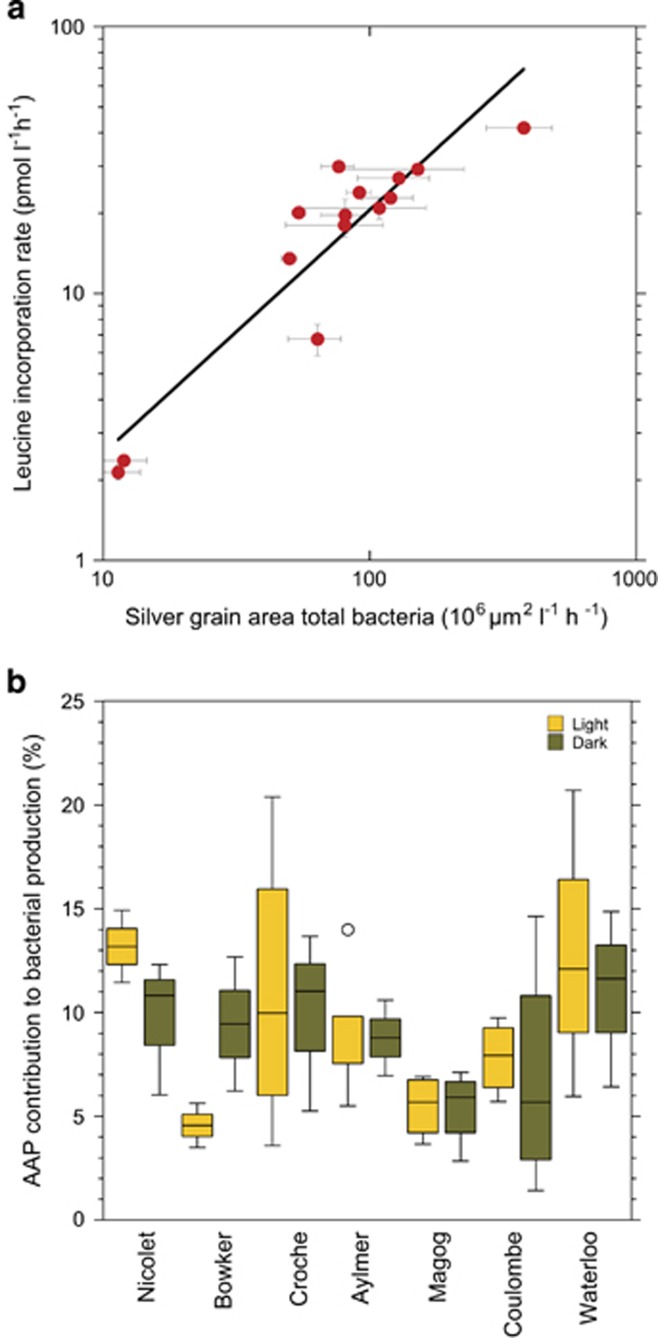
Relationship between bulk 3H-leucine incorporation rate and the total average SGA associated with the total bacterial community (a). The numbers are means+s.d. calculated with data from both light and dark incubations for the total community. The solid line is a linear regression fit through all log-transformed data (P<0.05). Contribution of AAP bacteria to total bacterial production in the lakes, ranked by increasing system productivity (b). For each lake, yellow and green bars show the contribution estimated from light and dark incubations, respectively. Central lines indicate median values, boxes indicate the lower and upper quartiles, whiskers depict the 10th and 90th percentiles and the dots represent outliers.

