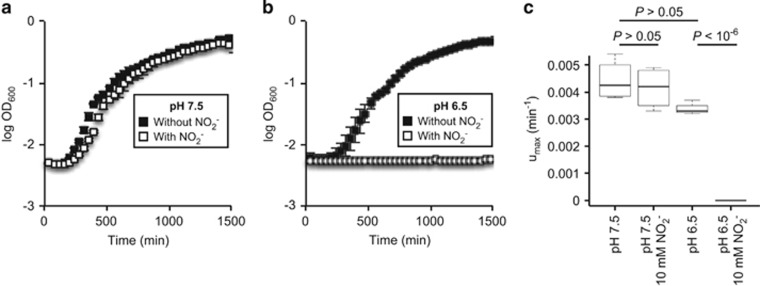
Figure 4.
pH dependence of nitrite (NO2−) inhibition. We grew completely consuming cells (strain A1601) (a) at pH 7.5 with or without 10 mm of nitrite, or (b) at pH 6.5 with or without 10 mm of nitrite under aerobic conditions and measured the OD600 values over time. We only plotted every fourth data point to facilitate visualization. (c) We measured the zero-order maximum specific growth rate (umax) from 10 consecutive data points that coincide with the most rapid period of growth for each individual culture. The data are presented as Tukey box plots. The P-values are for pair-wise comparisons using the two-sample Welch test (n=4).

