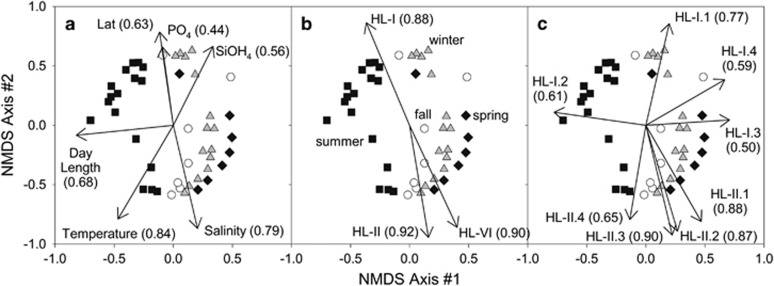
Figure 5.
NMDS of Bray-Curtis dissimilarities. Ordination of all HL OTUs with (a) environmental variables, (b) rarefied ecotype sequence abundance and and (c) rarefied sub-ecotype clade sequence abundance fitted to the distribution of sampling sites in the ordination space. The correlation of each variable to the distribution of sampling sites is represented in parentheses. Symbols correspond to the summer (squares), spring (diamonds), fall (circles) and winter (triangles) stations.

