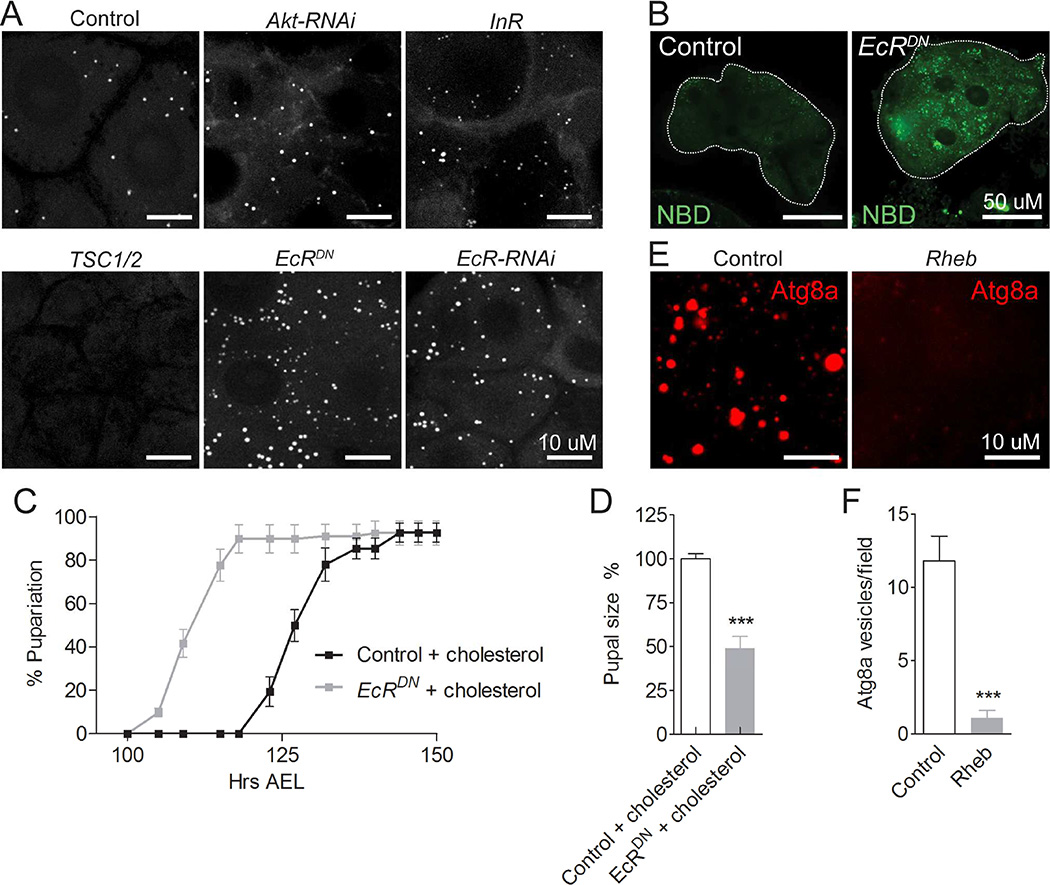
Figure 4. Opposing effects of TOR and EcR on cholesterol and lipid accumulation.
(A) CARS images of lipid droplets in PG cells with inhibition of TOR (expression of TSC1/2) or ecdysone feedback (expression of EcRDN or EcR-RNAi), or activation (expression of InR) or inhibition (Akt-RNAi) of insulin signaling. To allow development to L3, overexpression of TSC1/2 was induced 96 hours AEL by shifting L2 larvae from 18°C to 29°C and PG cells were imaged two days later. For all other genotypes larvae were reared at 25°C and the PG was assayed 120 hours AEL. (B) Ex vivo incubation assay reveals that inhibition of ecdysone feedback by expression of EcRDN leads to excessive NBD-cholesterol accumulation in PG cells. Developmental timing of pupariation (C) and pupal size (D) of animals overexpressing EcRDN in the PG compared to control animals on a high cholesterol diet (+ cholesterol). (E, F) Effect of TOR on autophagy (Atg8a punctae) in the PG. Detailed description of genotypes is given in Supplemental Experimental Procedures. Error bars indicate SEM (**P<0.01; ***P<0.001). See also Figure S4.

