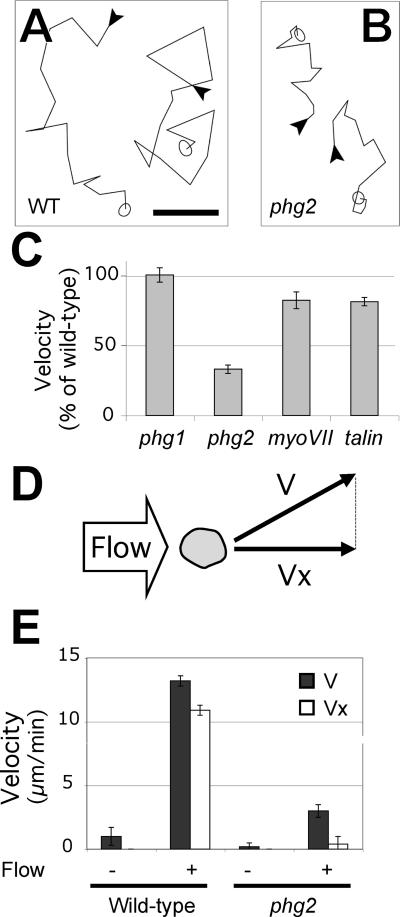
Figure 9.
Mutant phg2 cells show defects in motility. (A and B) Cells were allowed to settle onto a plastic substrate in phosphate buffer and their movement recorded at 4-min intervals for 60 min. Two typical traces showing movement of wild-type (A) or phg2 cells (B) are shown. The beginning of each trace is indicated with an arrowhead, and the amoeba is represented at the end of the trace. Bar, 50 μm. (C) The instantaneous speed was measured for at least 30 individual cells from each mutant population and expressed as a percentage of motility of wild-type cells (6.5 μm/min in these conditions). The mean and SEM are indicated. (D and E) Mutant phg2 cells are defective for shear-flow induced motility. (D) Schematic representation of a top view of the experimental setup. A slow lateral flow of medium exerts mechanical forces on Dictyostelium cells and induces their movement in the direction of the flow. The average cell speed (V) was determined with or without a flow of medium, as well as its projection along the flow axis (Vx) (E) V (full bars) and Vx (open bars) are indicated for wild-type and phg2 mutant cells. In the lateral flow chamber, the cells adhere on glass and this accounts for the lower motility of unstimulated cells compared with cells adhering on plastic.

