Figure 2.

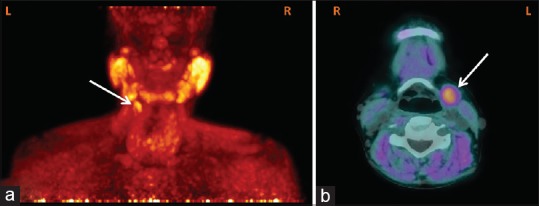
(a and b) Maximum intensity projection (posterior view) and transaxial images of 18F-choline photon emission tomography/computed tomography image showing the ectopic left superior parathyroid adenoma with intense uptake (white arrow)

(a and b) Maximum intensity projection (posterior view) and transaxial images of 18F-choline photon emission tomography/computed tomography image showing the ectopic left superior parathyroid adenoma with intense uptake (white arrow)