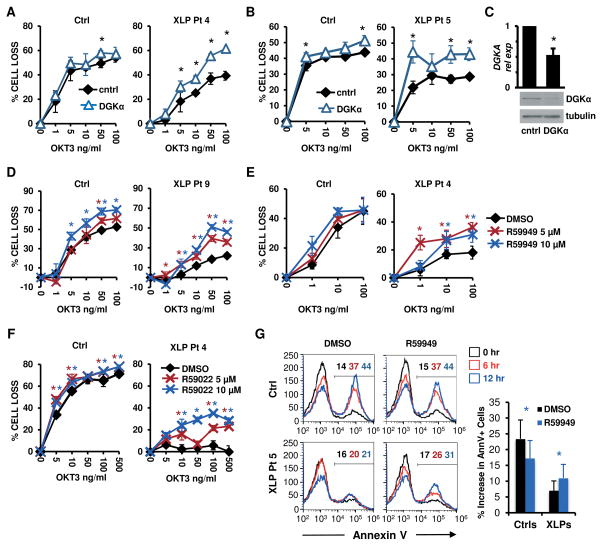
Figure 1. DGKα silencing or inhibition restores RICD in XLP-1 patient T cells.
(A–B) Activated T cells from normal donors (Ctrl) or indicated XLP-1 patients were transfected with control (cntrl) or DGKα-specific siRNA, then restimulated 4 days later with OKT3 Ab. After 24 hours, % cell loss was evaluated by PI staining. Data are mean ± SD of 2 experiments (A) or 1 experiment (B) performed in triplicate, representative of 2 independent experiments using different control donors.
(C) DGKα relative expression (rel exp) in siRNA-transfected cells from (A) measured by qRT-PCR (upper panel, mean ± SEM, n=4) or by Western blotting, with tubulin as loading control (lower panel).
(D–F) Ctrl or XLP patient T cells were restimulated with OKT3 Ab following pretreatment with DGK inhibitors R59949 or R59022 (5–10 μM), or DMSO. After 24 hours, % cell loss was evaluated by PI staining. Data are mean ± SD of 3 experiments (E), or 1 experiment (D, F) performed in triplicate representative of 2 independent experiments using different control donors.
(G) Cells used in (D) were pre-treated with R59949 (10 μM) or DMSO and restimulated with OKT3 (100 ng/ml) for 0, 6 and 12 hours. The % of apoptotic cells was measured by AnnexinV staining. Representative histograms are shown; marker numbers denote % AnnexinV+ cells. The net increase in AnnexinV+ cells at 12 hours is shown at right. Data are mean ± SD of 6 independent experiments using 4 separate controls and 2 XLP patients. Asterisks denote statistical significance by two-way ANOVA with Sidak correction (A–B, D–F) or paired t-test (C, G).

