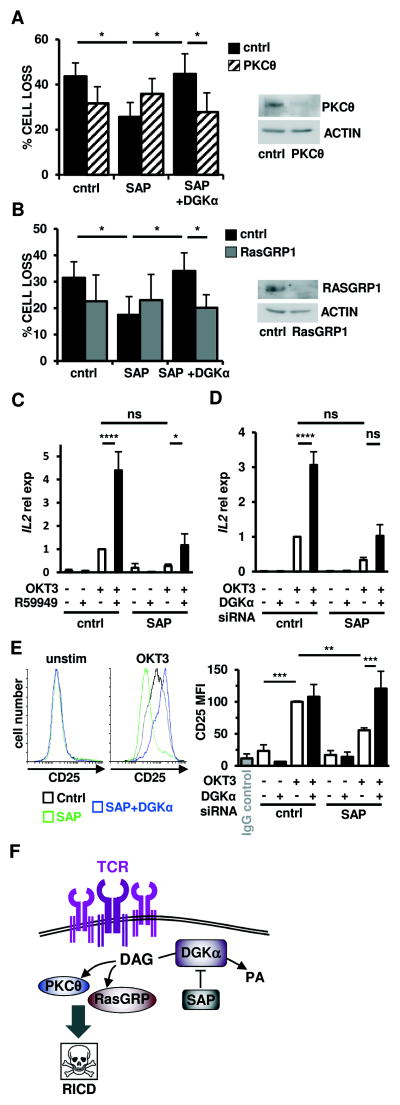
Figure 5. DGKα silencing restores TCR-induced PKCθ and Ras-mediated signaling pathways to drive RICD in SAP-deficient cells.
(A-B) Activated normal donor T cells were transfected with the indicated siRNA and restimulated 4 days later with OKT3 Ab (10 ng/ml). After 24 hours, % cell loss was evaluated by PI staining. Data are mean ± SEM of 7 (A) or 6 (B) experiments performed in triplicate. Right panels: expression of PKCθ (A) or RasGRP1 (B) was measured by Western blotting, with actin as a loading control.
(C–D) Quantitative RT-PCR for IL2 mRNA in T cells pre-treated with R59949 (10 μM) (C) or transfected with DGKα siRNA (D) after restimulation with OKT3 (10 μg/ml, 4 hours) GUSB served as the reference gene. Graphs represent mean ± SEM of 6 (C) or 7 (D) experiments.
(E) Left: Representative flow cytometric histograms showing CD25 surface expression on siRNA-transfected T cells from (A) ± OKT3 restimulation (24 hours). Right: graph depicts mean fluorescence intensity (MFI) of CD25 expression. Data are mean ± SEM of 4 experiments. Asterisks in all panels denote statistical significance by two-way ANOVA with Sidak correction.
(F) Schematic cartoon: SAP-mediated inhibition of DGKα activity ensures a sufficient pool of DAG required for proper IS organization and recruitment of PKCθ and RasGRP, which mediates downstream signaling for RICD.

