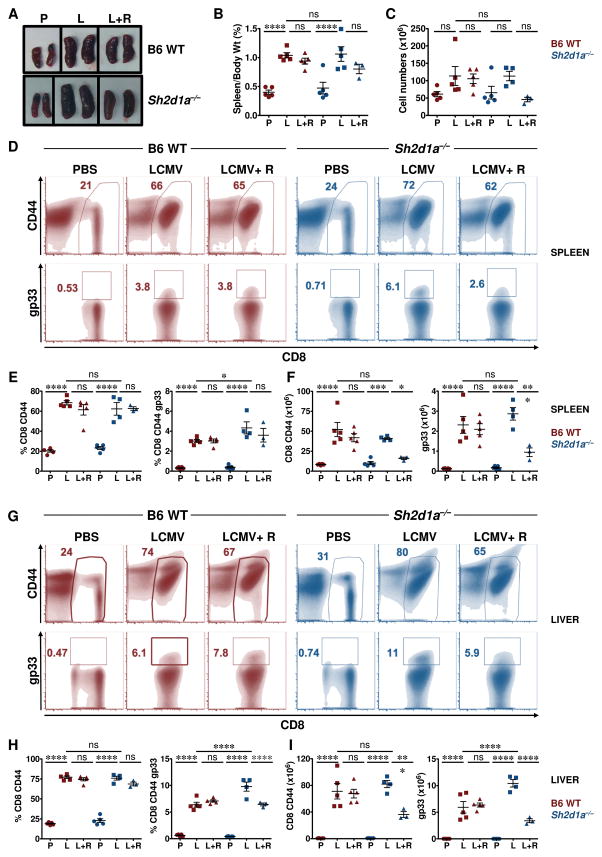
Figure 7. R59022 DGK inhibitor reduces the numbers of activated virus- specific CD8+ T cells in LCMV-infected Sh2d1a−/− mice.
(A) Images of spleens from uninfected (PBS, “P”) and LCMV infected mice without (LCMV, “L”) or with R59022 treatment (LCMV+R59022, “L+R”). Representative spleens from each cohort from B6 WT (top panel) and Sh2d1a−/− mice (lower panel) are shown.
(B) Ratio of spleen over body weight and (C) total splenocyte count for animals in each group are presented. B6 WT mice = red symbols, Sh2d1a−/− mice = blue symbols.
(D–I) Representative flow cytometric (density) plots showing the percentages of CD8+ CD44+ (top) and LCMV-specific CD8+ gp33+ (bottom) in the spleens (D) and livers (G) of B6 WT and Sh2d1a−/− mice. Percentages (E, H) and absolute numbers (F, I) of CD8+ CD44+ and CD8+ CD44+ gp33+ cells in the spleens (E, F) and livers (H, I) of B6 WT (red symbols) and Sh2d1a−/− (blue symbols) mice.
Data are from 1 of 2 experiments in which a total of 6–10 mice in each cohort was examined. Error bars represent SD. Asterisks denote statistical significance that was determined by two-way ANOVA with Sidak correction. ns: not significant.

