Figure 2.
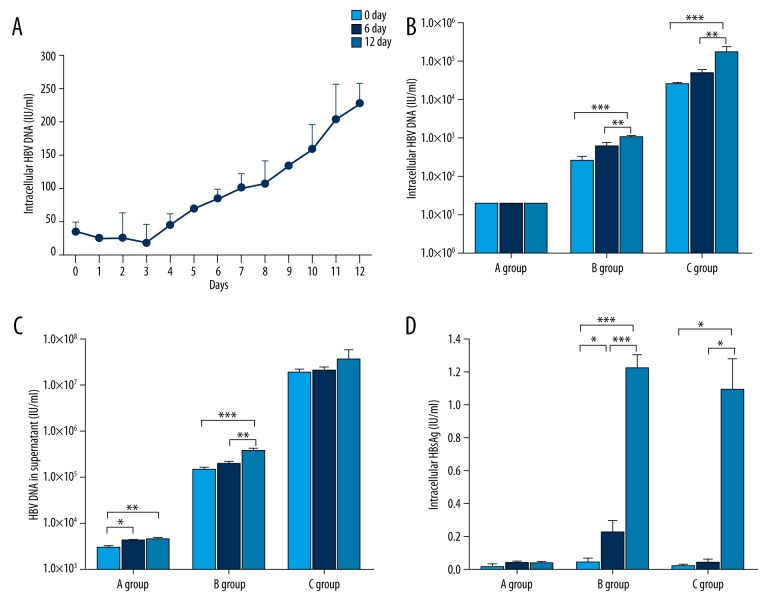
The pattern of infection and replication of HBV to CD34 positive cells in cord blood. (A) The CD34+ cells were incubated with HBV DNA-positive serum for 24 hours, and then washed and seeded. Intracellular HBV DNA increased gradually from Day 0 to Day 12, and ranged from 35.85±13.79 IU/mL (mean ± standard deviation) to 227.50±30.41 IU/mL. CD34+ HSCs were challenged by different load levels of HBV (HBV DNA of sera in Group A: 1.0×10⁴ IU/mL; Group B: 1.0×10⁶ IU/mL; Group C: 1.0×10⁸ IU/mL). The results are shown in B-D. In (B) the intracellular HBV DNA were under the limit of detection at different time points for Group A, whereas in Group B (p<0.001) and Group C (p<0.001) the levels of HBV DNA were significantly increased on Day 12 compared to Day 0. In (C) we compared HBV DNA in the culture supernatant on Day 12 with Day 0; Group A (p<0.01) and Group B (p<0.001) had significantly increased levels, and Group C had no significant difference (p>0.05), but still showed a growing trend. In (D) the intracellular HBsAg expressions of the three groups were analyzed, and the HBsAg of both Group B (p<0.001) and Group C (p<0.05) were significantly higher on Day 12 than Day 0, and Group A HBsAg expressions were under the detection limit (0.05 IU/mL). (* p<0.05, ** p<0.01, *** p<0.001).

