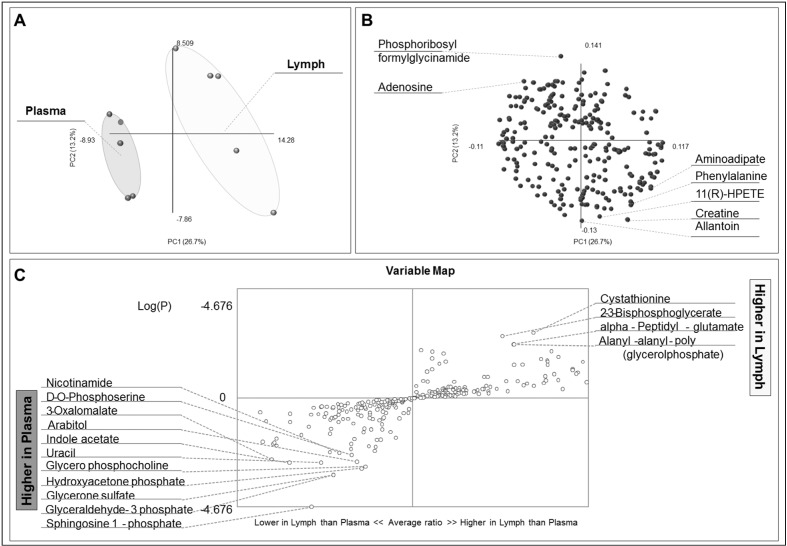
Figure 1.
Partial least square discriminant analysis (PLS-DA) was performed on the basis of metabolomics profiles of lymph vs plasma samples.
(A) Sample clustering across principal components (PCs) 1 and 2 indicating the metabolic profiles are sufficiently powered to discriminate sample biofluid origin. (B) Loading plot shows the distribution of metabolites (loading variables) across the same PCs as in (A). Seven variables with the highest loadings are highlighted. (C) Fold changes and p-values are used to discriminate metabolites increasing or decreasing in lymph samples in comparison to matched plasma, plotted in the top right and bottom left quadrants, respectively.

