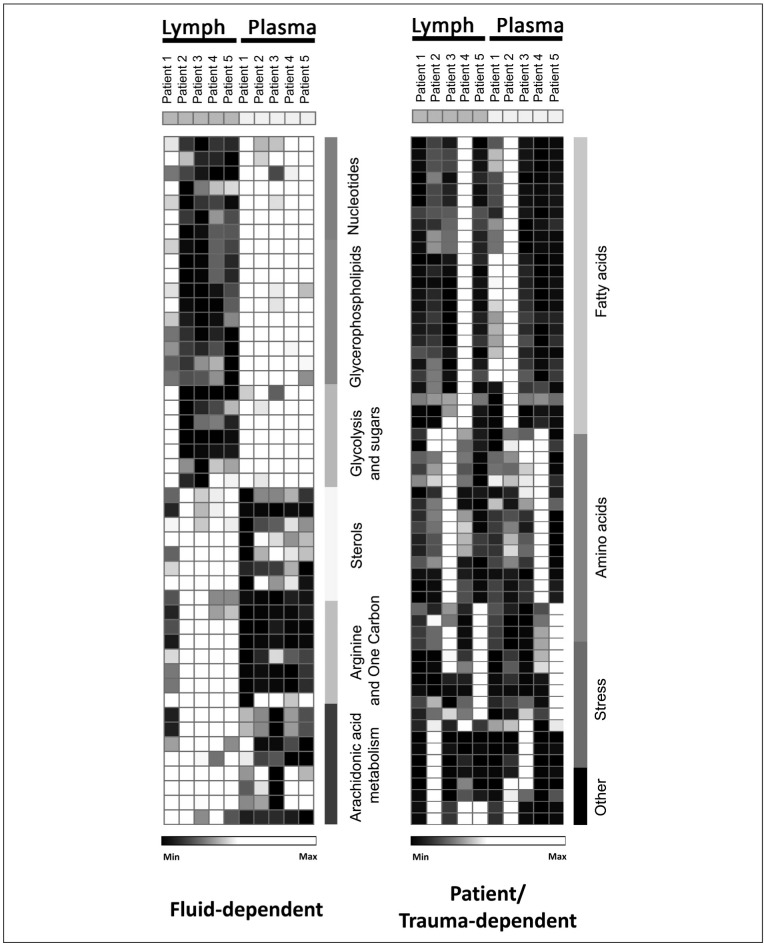
Figure 2.
Hierarchical clustering analyses of quantitative dynamic changes of mesenteric lymph and plasma metabolites.
Each row represents a metabolite in each one of the 5 lymph- or plasma-matched samples. Relative quantitation has been performed upon intra-row Z-score normalisation using GENE E software (Broad Institute). Colour codes range from white to black (low to normal to high values, respectively). In the left column, fluid-dependent changes are plotted, indicating metabolites increasing either in plasma or lymph (from top to bottom). (Right column) Metabolites are highlighted that increase in matched plasma-matched and lymph-matched biological samples, indicating either a donor or trauma specificity. An extended full colour version of this figure, also including metabolite names and hierarchical clustering classifications, is provided in the Online Supplementary Figure 1.

