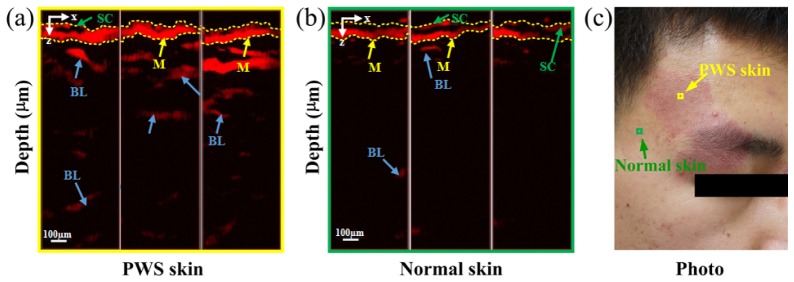
Fig. 5.
Photoacoustic mapping of PWS skin and normal skin. (a) Photoacoustic images of a PWS lesion in the forehead. (b) Photoacoustic images of the normal skin near the PWS lesion in the forehead. The images show three consecutive cross-section PA maps along the x axis, in which the epidermis is marked with dotted lines. (c) Photograph of the PWS patient’s face. The yellow and green arrows indicate the detection areas of the normal and PWS skin, respectively.

