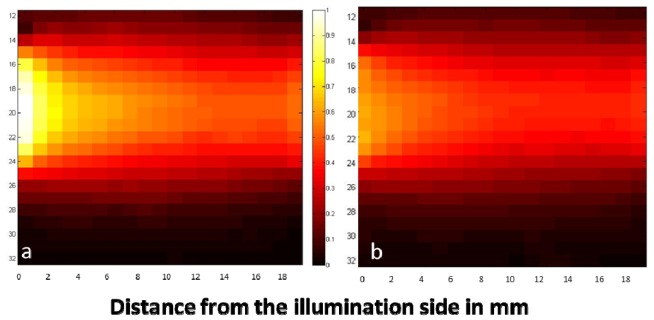
Fig. 5.
Raman scattering 2D plots of Phantom 3 (μ’s = 13.82 cm−1, μa = 0.8 cm−1) with (a) and without (b) the photon diode in a transmission mode. Laser photons are injected on the left of the image and Raman signal is collected on the right. The plots depict the intensity of ~1193 cm−1 Raman band of trans-stilbene as the vial moves to different positions in the phantom. The 2D plot (b) has been normalized against the maximum intensity of the diode map (a).

