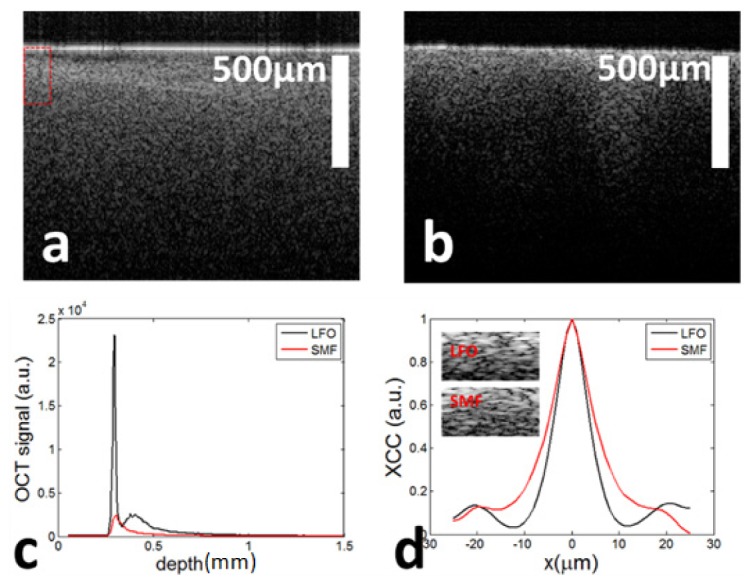
Fig. 6.

OCT image of phantom obtained from LFO probe (a) and bare fiber probe (b); (c) averaged A-scans obtained from LFO probe (black curve) and bare fiber probe (red curve); (d) ensemble average of Pearson cross correlation coefficients (XCC) for LFO probe (black curve) and bare fiber probe (red curve).
