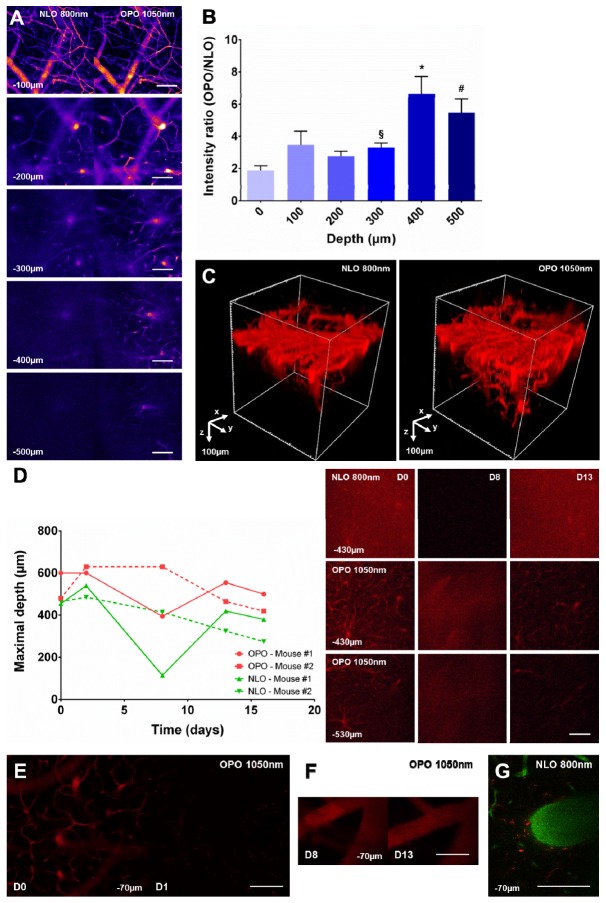
Fig. 2.
OPO is more efficient than NLO to excite QD655 in the healthy mouse brain and it increases the maximal achievable imaging depth. (A). Images taken at various depths (100 to 500µm below the dura-mater) under an 800nm NLO or 1050nm OPO excitation in the same region of interest in the brain of a living mouse intravenously injected with a solution of QD655. (B). QD655 signal intensity ratio (OPO/NLO) measured at various depths. n = 18, 18, 18, 18, 16 and 9 measurements from 3 independent acquisitions. §: p = 0.0026, 300 vs. 0µm ; *: p<0.004, 400 vs. 0, 100, 200 and 300µm ; #: p<0.02, 500 vs. 0, 100, 200, 300µm ; Mann-Whitney test. (C). Tridimensional reconstruction of brain blood vessels under an 800nm NLO or 1050nm OPO excitation in the same region of interest. (D). Left: maximal imaging depth achievable over time from 0 to 16 days (D) post-surgery under NLO and OPO excitation in 2 different mice. Right: Representative images from mouse #1 at different depths, excitation modalities and time post-surgery. (E). Images taken at the same level (−70µm) under a 1050nm OPO excitation at D0 and D1 after an unique intravenous injection of QD655 at D0. (F). Images taken at the same level (−70µm) under a 1050nm OPO excitation at D8 and D13 after repeated intravenous injection of QD655 at D0, D2, D8 and D13. (G). Image taken at −70µm under a 800nm NLO excitation 5 days after an intravenous injection of Rhodamine-dextran 70kDa (red). Blood-vessels are highlighted by an intravenous injection of Texas-red dextran 70kDa (green) prior to imaging. Note the accumulation of Rhodamine dextran 70kDa (red) in macrophages as a consequence of previous injections.

