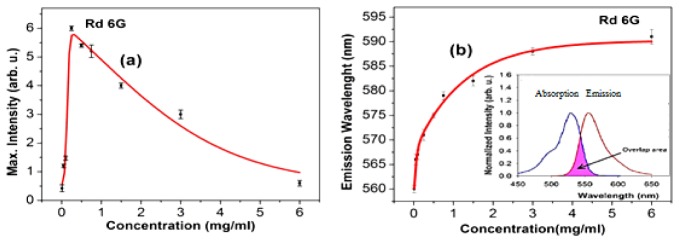
Fig. 3.
(a) Corresponding peak intensity of Rd6G as a function of concentration, inset: Laser induced fluorescence spectra at various concentration, (b) Spectral shift in terms of Rd6G concentration, inset: overlapping area of the normalized absorption-emission spectra. The FWHM of absorption spectra is invariant while that of emission spectra gradually decreases as a function of the concentration emphasizing the commonalities between of DOX and Rd6G.

