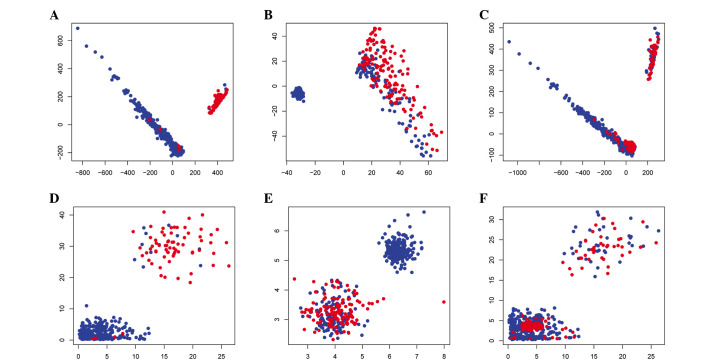
Figure 2.
Scatter diagrams showing the classification results. Blue dots indicate FLT3/ITD mutation-negative samples and red dots indicate FLT3/ITD mutation-positive samples. Classification according to the SVM method for (A) the training group, (B) the test group and (C) the combined group. Classification according to the RF method for (D) the training group, (E) the test group and (F) the combined group. SVM, support vector machine; RF, random forest.

