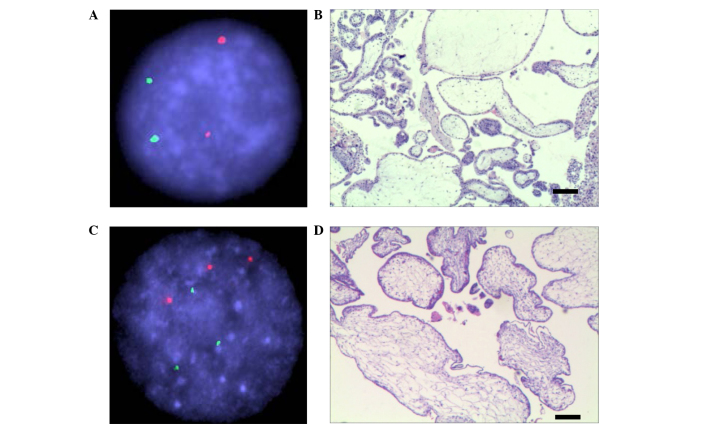
Figure 2.
FISH and pathology sections, and microscopic sections and hematoxylin and eosin staining of the villous tissue, for two representative patients (nos. 3 and 4 in the present study). (A) FISH analysis with chromosome 13 (stained green) and 21 (stained red) for patient 3. (B) The microscopic section and hematoxylin and eosin staining of the villous tissue for patient 3 provides a representative image of complete hydatidiform mole. (C) FISH analysis of patient 4. (D) The microscopic section of patient 4 provides a representative image of partial hydatidiform mole. Scale bar=200 µm. FISH, fluorescence in situ hybridization.

