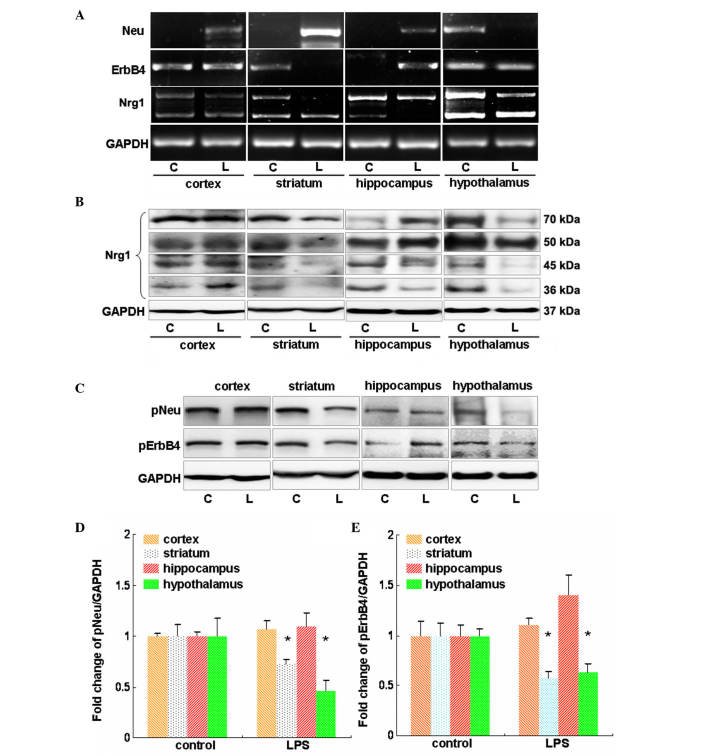
Figure 2.
Evaluation of the effects of LPS on Nrg1 expression and Neu and ErbB4 expression and activation in mouse cortex, striatum, hippocampus and hypothalamus. (A) Reverse transcription-polymerase chain reaction analysis of the influence of LPS on the mRNA levels of Nrg1, Neu and ErbB4. (B) Western blot analysis of the effect of LPS on the protein levels of multiple isoforms of Nrg1. (C) Western blot analysis of the effect of LPS on the phosphorylation-induced activation of Neu and ErbB4. Quantification of the (D) Neu and (E) ErbB4 westernblot results. Independent Student's t-test was applied. *P<0.05 vs. the control group (control group, n=3; LPS group, n=4). LPS, lipopolysaccharide; Nrg1, neuregulin-1; C, control group; L, LPS group; GAPDH, glyceraldehyde 3-phosphate dehydrogenase; p-, phosphorylated.

