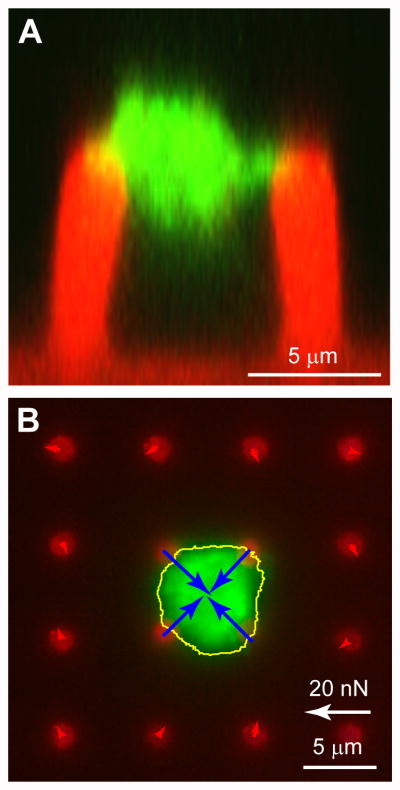
Figure 2.
Measurement of platelet forces and thrombus volume. (A) Side view image of microthrombus attached to two posts was generated from a Z-stack series of confocal microscopy images. The PDMS of the posts has been stained with DiI (red) and platelet actin with phalloidin (green). The bulk of the thrombus structure lie in between the posts and is connected at the tips of the posts. The volume of the clot is measured by voxel measurements of the actin signal in the Z-stack. (B) Example of contraction force measurements using quasi-static technique. The outline of the clot (yellow line) and its contractile forces (blue arrows) have been determined by image analysis of the post deflections. There is good signal-to-noise in the approach as indicated by the low forces (red arrows) at the posts surrounding the clot.

