
Figure 4. Visualization of the gHgLgO-PDGFRα complex.
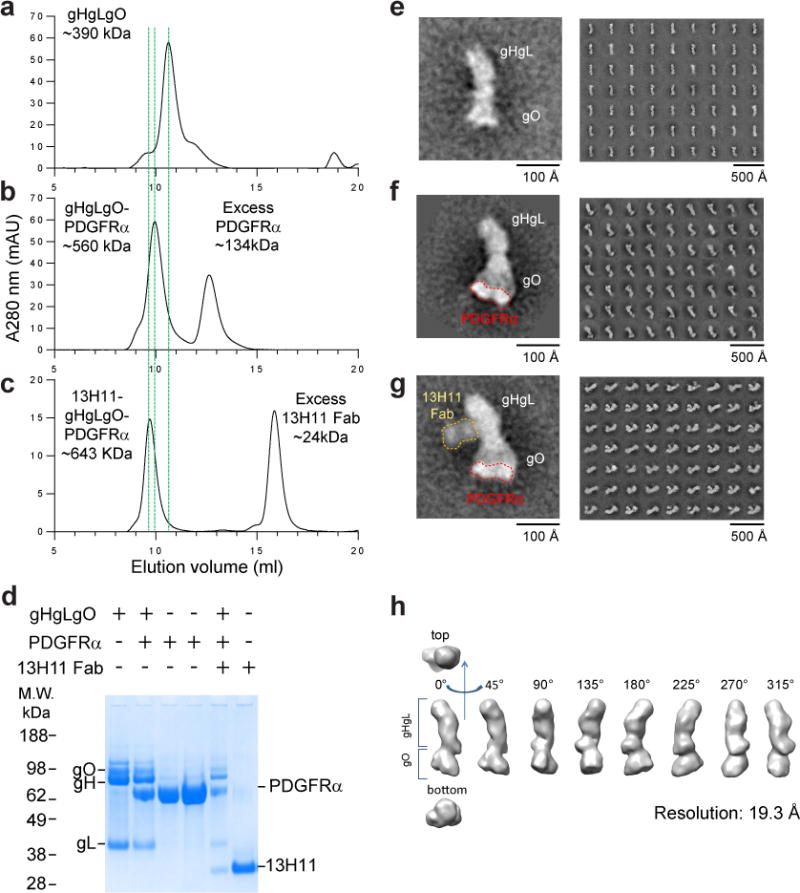
(a–c) Size exclusion chromatography profiles of gHgLgO alone (a) or in complex with soluble PDGFRα (b) or with PDGFRα and a Fab fragment of the anti-gH antibody 13H11 (c). The shifts of the elution time caused by formation of binary and ternary complexes were marked with green dashed lines. SDS-PAGE analysis under reducing conditions of individual protein and complexes containing gH/gL/gO, PDGFRα and 13H11 Fab in different combinations isolated by size-exclusion (d). (e–g) Negative-stain electron microscopy and reference free 2D class averages of gHgLgO and its complexes purified by size exclusion chromatography. One representative image from each purification step was zoomed in to show the shape of the molecules and addition of volume. Trimer alone (e) or with receptor PDGFRα bound to gO. Of note, for the gHgLgO-PDGFRα complex, PDGFRα is only well resolved in some averages (f) or with the 13H11 Fab bound to the twisted region of gH in the gHgLgO-PDGFRα complex (g). Three-dimensional map of gHgLgO at 19.3 Å of resolution.