Figure 4.

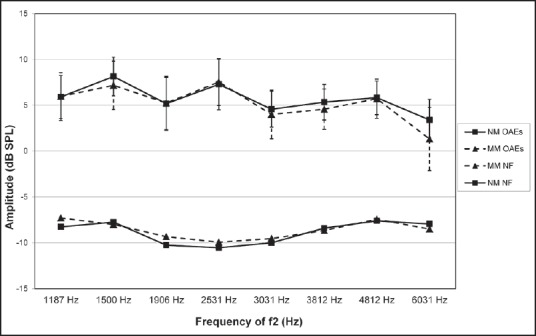
Mean DPOAE amplitudes for the left ears of music majors (MM, n = 28) and nonmusic majors (NM, n = 35), with corresponding noise floor values. Error bars indicate 95% confidence intervals of the means

Mean DPOAE amplitudes for the left ears of music majors (MM, n = 28) and nonmusic majors (NM, n = 35), with corresponding noise floor values. Error bars indicate 95% confidence intervals of the means