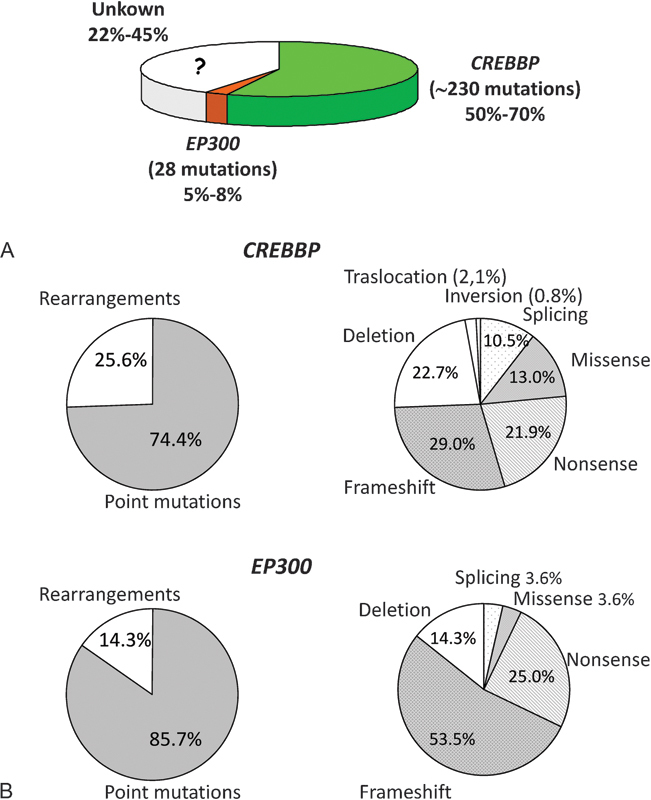
Fig. 2.

Mutational spectra of RSTS. (A) Genetic and allelic heterogeneity of RSTS. The relative frequency of CREBBP and EP300 mutations found in RSTS patients is reported in the pie chart. (B) Frequency of mutations found in CREBBP (upper panel) and EP300 (lower panel). Proportion of point mutations versus rearrangements is on the left. Details of specific type of point mutations versus rearrangements are on the right.
