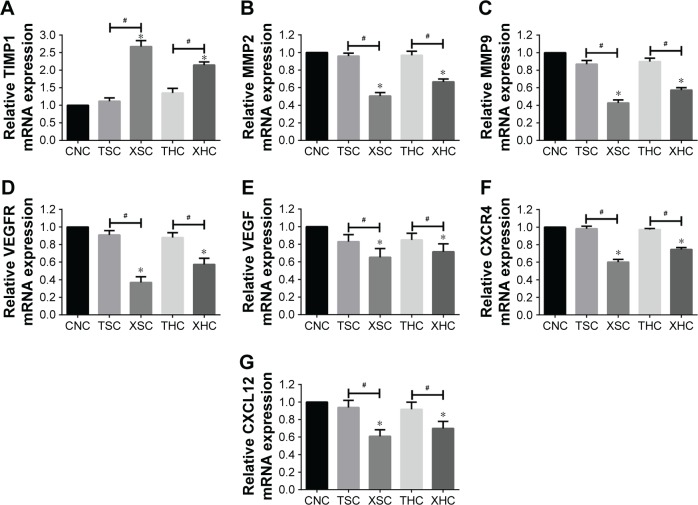
Figure 1.
The relative mRNA expression of targeted genes was measured by RT-PCR in U251 cells with different treatments.
Notes: (A) TIMP1, (B) MMP2, (C) MMP9, (D) VEGFR, (E) VEGF, (F) CXCR4, and (G) CXCL12. *Versus group CNC, P<0.05; #Group XSC versus group TSC and group XHC versus group THC, P<0.05. Group CNC: U251 cells were cultured with normal saline, control group. Group TSC: U251 cells were cultured with serum of SD rats treated with TST, medicine control group. Group XSC: U251 cells were cultured with serum of SD rats treated with XZT. Group THC: U251 cells were cultured with serum of SD rats treated with homogenate of TST. Group XHC: U251 cells were cultured with serum of SD rats treated with homogenate of XZT.
Abbreviations: RT-PCR, reverse transcription-polymerase chain reaction; SD, Sprague Dawley; TST, TaohongSiwu Tang; XZT, XuefuZhuyu Tang.

