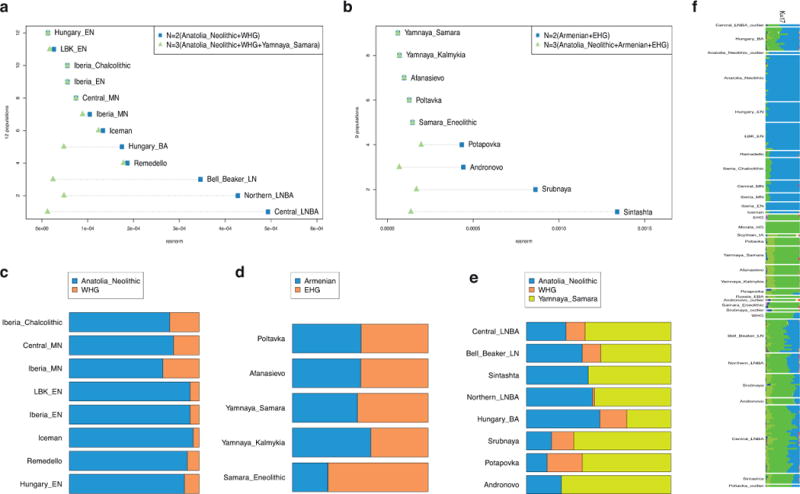
Extended Data Figure 2. Early isolation and later admixture between farmers and steppe populations.

A: Mainland European populations later than 3000 BCE are better modeled with steppe ancestry as a 3rd ancestral population. B: Later (post-Poltavka) steppe populations are better modeled with Anatolian Neolithic as a 3rd ancestral population. C: Estimated mixture proportions of mainland European populations without steppe ancestry. D: Estimated mixture proportions of Eurasian steppe populations without Anatolian Neolithic ancestry. E: Estimated mixture proportions of later populations with both steppe and Anatolian Neolithic ancestry. F: ADMIXTURE plot at k=17 showing population differences over time and space.
