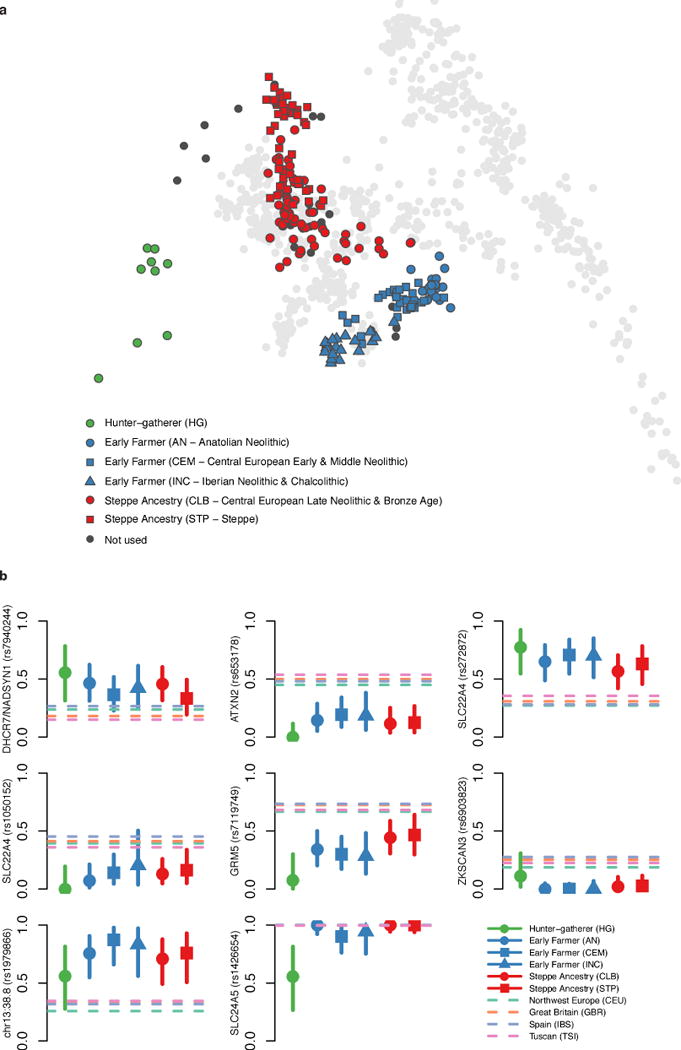
Extended Data Figure 4. PCA of selection populations and derived allele frequencies for genome-wide significant signals.

A: Ancient samples projected onto principal components of modern samples, as in Fig. 1, but labeled according to selection populations defined in Extended Data Table 1. B: Allele frequency plots as in Fig. 3. Six signals not included in Fig. 3 – for SLC22A4 we show both rs272872, which is our strongest signal, and rs1050152, which was previously hypothesized to be under selection – and we also show SLC24A5, which is not genome-wide significant but is discussed in the main text.
