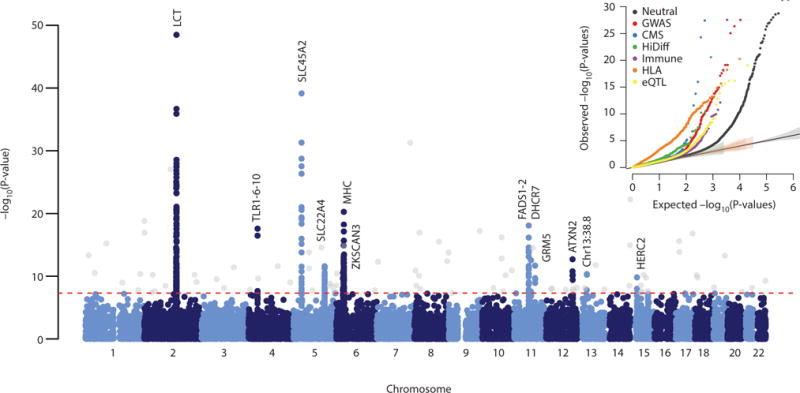
Figure 2. Genome-wide scan for selection.

GC-corrected −log10 p-value for each marker (Methods). The red dashed line represents a genome-wide significance level of 0.5×10⁻⁸. Genome-wide significant points filtered because there were fewer than two other genome-wide significant points within 1Mb are shown in grey. Inset: QQ plots for corrected −log10 P-values for different categories of potentially functional SNPs (Methods). Truncated at −log10(P-value)=30. All curves are significantly different from neutral expectation.
